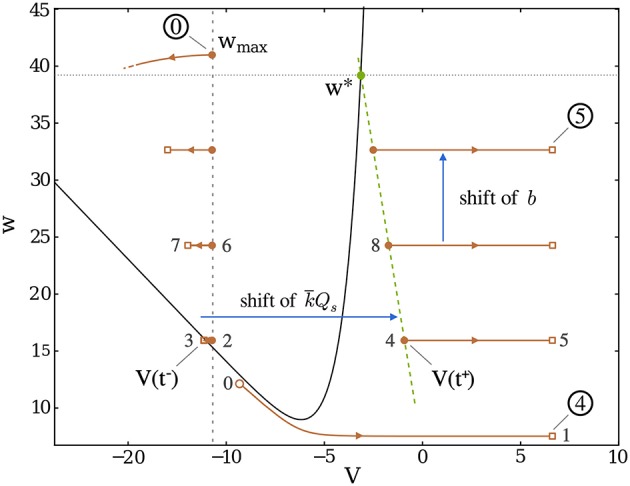
Figure 5.

Trajectory of a “Dirac burst” in dimensionless phase space; the gray numbers indicate the order of the burst initiation. After a reset, the potential first decreases (leftmost parts of the trajectory) until the spike arrives (brown square), at which point the potential is suddenly shifted to the corresponding brown dot on the rightmost part of the trajectory. The decay before the spike arrival becomes more and more significant as w increases since it contributes negatively to . Burst continues until w becomes greater than w*, denoted by the green dot, where the V-nullcline (black line, representing the set of points (VNV(w), w)) is crossed. Once wmax is reached (circled 0), the burst ends and the recovery period starts.
