Figure 1.
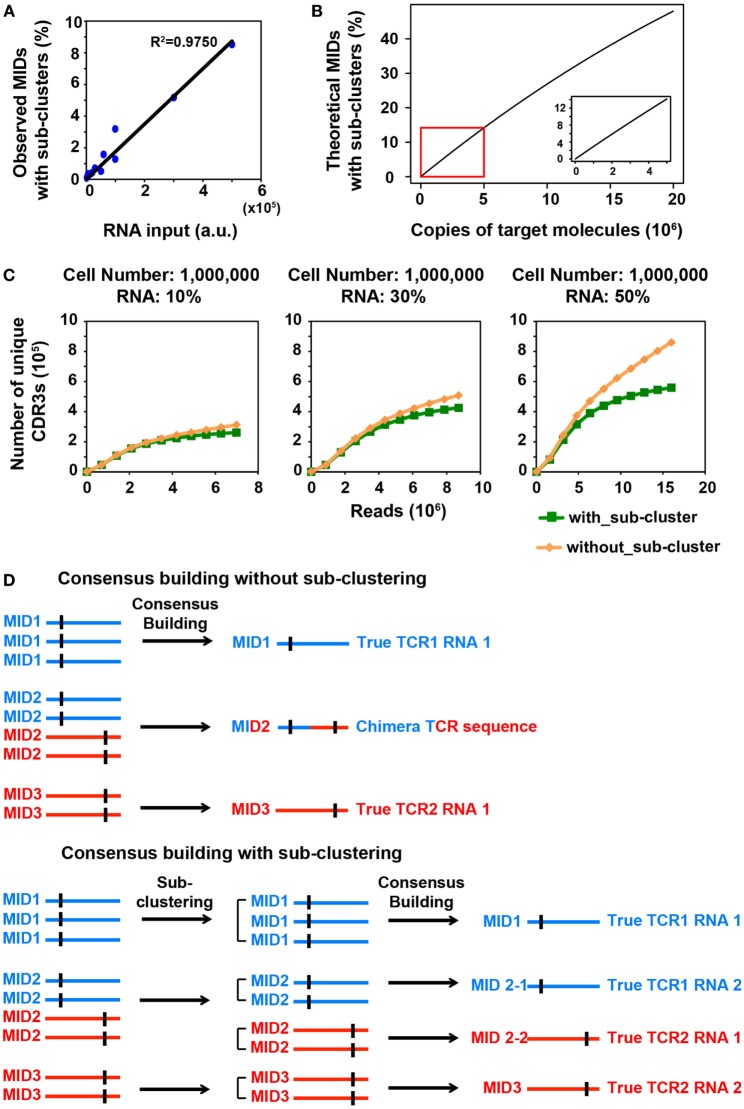
MID Clustering-based IR-Seq improves accuracy of T cell receptor (TCR) diversity estimation with sub-clustering. (A) The percentage of observed molecular identifiers (MIDs) containing sub-clusters is linearly dependent on RNA input, which is defined as cell number multiplied by percentage of RNA (e.g., 20,000 cells with 10%RNA is equivalent to 2,000 RNA input). Line represents linear regression fit, F-test on the slope, p < 10−9. (B) The theoretical percentage of MIDs with sub-clusters is approximately linearly dependent on copies of target molecules when copies of target molecules are less than 5,000,000 (bottom right insert). The theoretical percentage of MIDs with sub-clusters was calculated by Eq. 2 in Section “Materials and Methods.” (C) Rarefaction curve of unique complementarity-determining regions 3 (CDR3s) with or without sub-clustering. Number of unique CDR3s in three libraries made with three different RNA inputs from sorted one million naïve CD8+ T cells are shown here. Data from other cell inputs are in Figure S2 in Supplementary Material. (D) Illustration of consensus TCR sequence building without (top) and with (bottom) sub-clustering. Top: without sub-clustering, chimera sequences are generated when different TCR RNA molecules are tagged with the same MID; bottom: TCR RNA molecules that are tagged with same MID are sub-clustered to reveal truly represented TCR sequences. Short vertical black lines indicate nucleotide differences between two TCR sequences.

