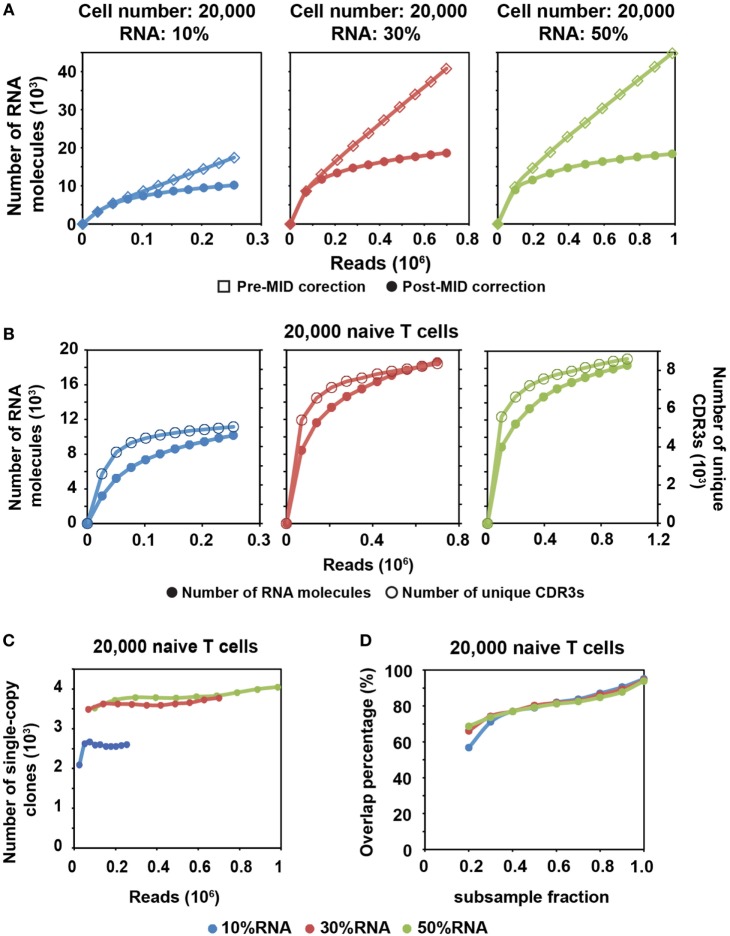
Figure 2.
MID Clustering-based IR-Seq is capable of accurate digital counting of T cell receptor (TCR) RNA molecules. (A) Rarefaction curve of detected TCR RNA molecules before and after error correction on molecular identifiers (MIDs) in 20,000 naïve CD8+ T cells for three RNA input amounts. Data from other cell inputs are in Figure S4 in Supplementary Material. (B) Comparison of rarefaction curve of detected RNA molecules and unique complementarity-determining regions 3 (CDR3s) in 20,000 naïve CD8+ T cells for three RNA input amounts. (C) Rarefaction curve of number of unique CDR3s with single RNA copy in 20,000 naïve CD8+ T cells for three RNA input amounts. Sequencing reads were subsampled to different depth and unique CDR3s were tallied. Data from other cell inputs are in Figure S6A in Supplementary Material. (D) The percentage of overlapping clones with single RNA copy at different sequencing depths by sub-sampling in 20,000 naïve CD8+ T cells for three RNA input amounts. The overlapping clones were compared between two adjacent sub-samplings and overlap percentage was calculated by dividing the number of overlapping clones by the total number of clones observed in the deeper sub-sampling. Data from other cell input are in Figure S6B in Supplementary Material.

