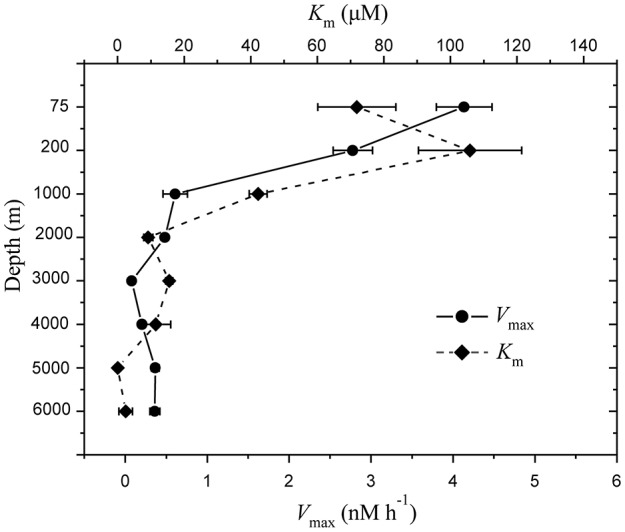
Figure 5.

Depth profile of extracellular proteolytic enzyme activities in the water column of the New Britain Trench, showing the mean maximum rates of hydrolysis Vmax ( ) and the half-saturation constants, Km (
 ).
).

Depth profile of extracellular proteolytic enzyme activities in the water column of the New Britain Trench, showing the mean maximum rates of hydrolysis Vmax ( ) and the half-saturation constants, Km (
 ).
).