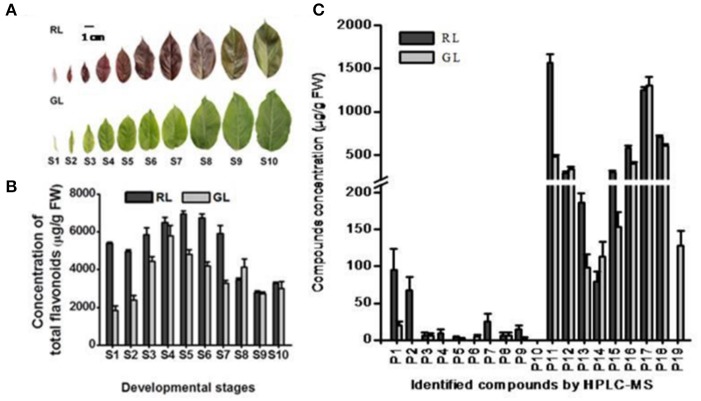
Figure 1.
Analysis of phenotypes and compound compositions detected by HPLC in Malus ever-red (RL) and ever-green leaves (GL). (A) Phenotypes of leaves at 10 developmental stages of RL and GL. Scale bar represents 1.0 cm. (B) HPLC analysis of total detected compounds at the 10 developmental stages in RL and GL. The data (mean ± SD) are the sum for each detected compound. S1–S10, the leaves at the 1st to 10th nodes on the annual shoot from the tip toward the base, represent the 10 leaf developmental stages. (C) HPLC analysis of each compound detected in the leaves at the 10 developmental stages of RL and GL. The data show the average values (mean ± SD) of the compounds in S1–S10. P1–P19 is the same as in Table 1.

