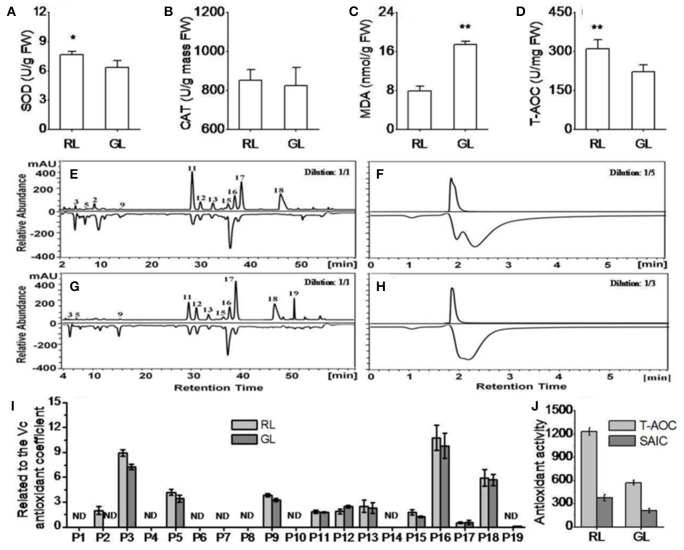
Figure 4.
Antioxidant capacity of the detected flavonoid compounds in the extracts of RL and GL determined by HPLC-ABTS in vitro. (A,B) Superoxide dismutase (SOD) and catalase (CAT) activities. (C,D) Malondialdehyde (MDA) and total antioxidant capacity (T-AOC) levels. (E,F) Antioxidant activity (negative peaks) of each detected flavonoid compound (positive peaks) in RL and GL, respectively. (G,H) Total antioxidant activities (negative peaks) of the detected flavonoid compounds (positive peaks) in RL and GL, respectively. For each sample, the extract solution was diluted five-fold in RL and three-fold in GL. (I) Individual flavonoid compounds related to the Vc antioxidant coefficient in RL and GL. (J) Comparison of T-AOC (HPLC-ABTS) levels and sum of the antioxidant activities of the individual compounds (SAIC) (negative peak area) in RL and GL. The UV profile was monitored at 350 nm on the chromatogram, while the scavenging activity profile was determined using HPLC-ABTS and monitored at 517 nm (negative peaks). The values shown are the mean ± SD (N = 10/group). ** and * indicate significance at P < 0.01 and P < 0.05 by t-test, respectively.

