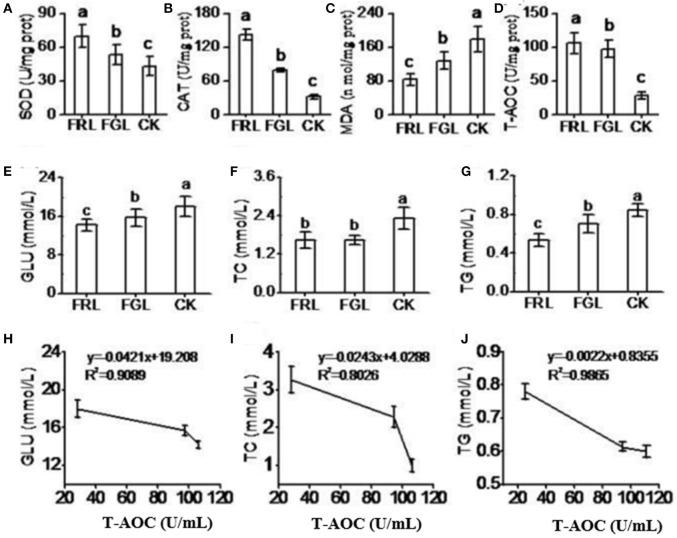
Figure 5.
Antioxidant capacity in rat serum. (A–G) CK, the normal control group of rats receiving the basic diet and distilled water; FRL, the treatment group of rats receiving the basic diet and red leaf extract solution (50 mg/kg/day, dissolved in distilled water); FGL, the treatment group of rats receiving the basic diet and green leaf extract solution (50 mg/kg/day, dissolved in distilled water). GLU, blood glucose; TC, cholesterol; TG, triglyceride. (H–J) Regression analysis of T-AOC to GLU (H), TC (I), and TG (J) in rat serum. The values are expressed as the mean ± SD (N = 10/group). Lower-case letters indicate significance at P < 0.05 by Duncan's new multiple range test.

