
Figure 7.
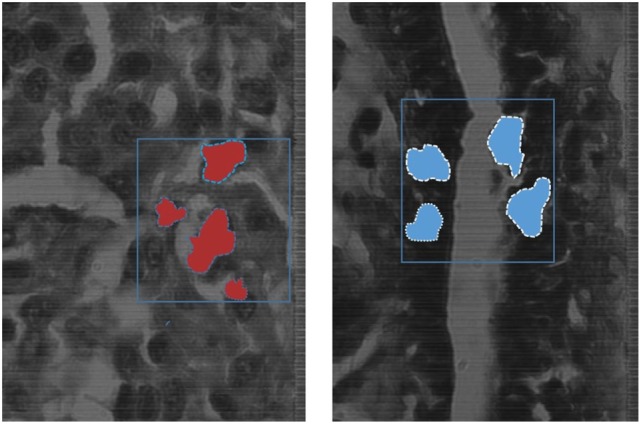
The blue boxes indicates the areas marked by the pathologist, the shaded areas shows the detection of the K-means algorithm detecting cancer tissues (red), and normal tissues (blue) on the spectral channel 550 nm.
Official websites use .gov
A
.gov website belongs to an official
government organization in the United States.
Secure .gov websites use HTTPS
A lock (
) or https:// means you've safely
connected to the .gov website. Share sensitive
information only on official, secure websites.
The blue boxes indicates the areas marked by the pathologist, the shaded areas shows the detection of the K-means algorithm detecting cancer tissues (red), and normal tissues (blue) on the spectral channel 550 nm.