Figure 1.
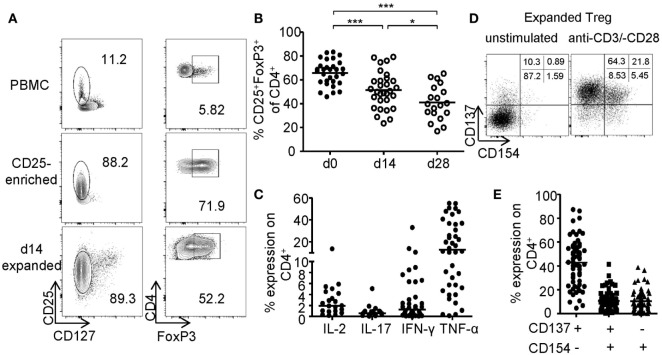
Phenotype of in vitro expanded regulatory T cells (Tregs). CD25+ Tregs were sorted and expanded for 14 or 28 days before analysis of (A,B) FoxP3 expression; (A) representative dot plot of one donor and (B) statistical analysis of several donors (n = 30 from nine independent experiments for d0 and d14, and n = 19 from seven different experiments for d28). (C) Cytokine expression was analyzed on d28 after 6-h restimulation with PMA/ionomycin (n = 38 from 12 different experiments for IFN-γ, n = 40 from 13 different experiments for TNF-α, n = 19 from 7 different experiments for IL-17, and n = 17 from 6 different experiments for IL-2). (D,E) CD137 and CD154 expression were analyzed on expanded Tregs on d14 after restimulation with anti-CD3/-CD28; (D) representative dot plot of one donor and (E) statistical analysis of several donors (n = 64, 21 independent experiments were performed). (B,C,E) Each dot represents one donor, and (B) statistical significances were determined by one-way analysis of variance; lines indicate (B) mean or (C,E) median.

