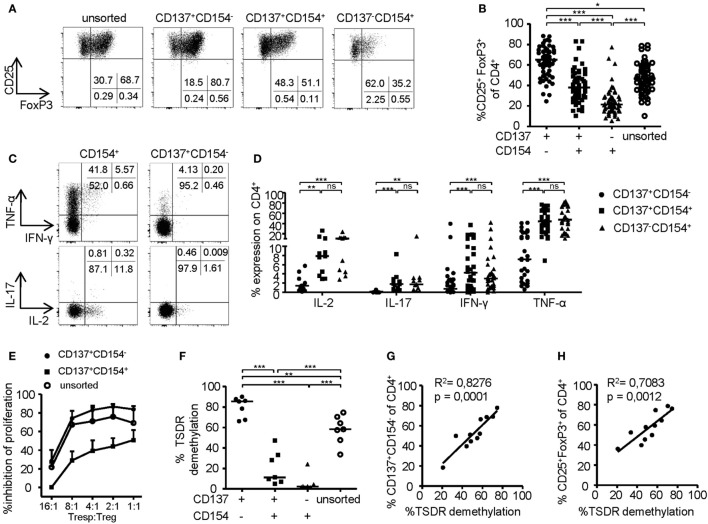
Figure 2.
Phenotype of CD137- and CD154-expressing cells within expanded regulatory T cell (Treg) cultures. (A,B) CD25+ Tregs were sorted and expanded before analysis of FoxP3 expression; (A) representative dot plot of one donor and (B) statistical summary of several donors (n = 61, 20 independent experiments were performed). (C,D) CD25+ Tregs were sorted and expanded before 6-h restimulation with PMA/ionomycin for analysis of cytokine expression on CD137- and CD154-expressing cells; (C) representative dot plot of one donor and (D) statistical summary of several donors (n = 30 from nine different experiments for IFN-γ and TNF-α, n = 11 from four different experiments for IL-17 and IL-2). (E) Tregs were sorted from expanded CD25+ Tregs according to CD137 and CD154 expressions or left unsorted, and all populations were expanded for another 14 days before in vitro suppression of proliferation of CD4+CD25− effector T cells was analyzed (n = 4–6, two independent experiments were performed); inhibition of proliferation relative to untreated responder T cell (Tresp) is shown. (F) Tregs were sorted from expanded cultures according to CD137 and CD154 expression after 6-h restimulation with anti-CD3/anti-CD28 before Treg-specific demethylated region (TSDR) demethylation was analyzed (n = 7, two independent experiments were performed). (G,H) CD25-enriched Tregs were expanded for 14 or 28 days before analysis of TSDR demethylation; correlation of TSDR demethylation with (G) CD137+CD154− expression, and (H) FoxP3 expression is shown (n = 11, three independent experiments were performed). Statistical significances were determined by (B,F) Kruskal–Wallis test, (D) Friedman test, or (G,H) linear regression analysis. (B,D,F,G,H) Each dot represents one donor, lines indicate (B,D,F) median, (E) mean ± SEM is shown.

