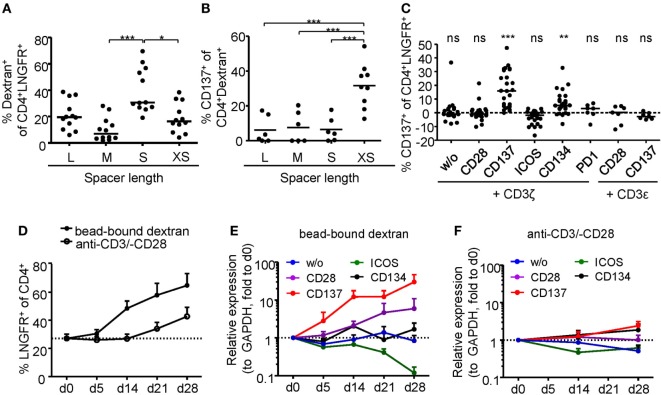
Figure 5.
Comparison of regulatory T cell (Treg) activation by different chimeric antigen receptor constructs. (A–B) CD25-enriched Tregs were transduced with dextran (Dex)–CAR constructs with different spacer lengths (L = 228aa, M = 119aa, S = 45aa, XS = 12aa), and (A) binding of FITC-labeled Dex was analyzed (n = 12, four independent experiments were performed). (B) CAR–Tregs were restimulated for 6 h with 2 µg/ml FITC-labeled Dex, and CD137 expression was analyzed on Dex-binding cells; CD137 expression in unstimulated samples was subtracted, and negative values were set to 0 (n = 6–9, and two to three independent experiments were performed). (C–F) CD25-enriched Tregs were transduced with Dex–CAR constructs with different costimulatory domains combined with CD3ζ or CD3ε. (C) CD137 expression was analyzed on CAR–Tregs after 6-h restimulation with bead-bound Dex, and CD137 expression in unstimulated samples was subtracted (n = 22–26, seven to eight different experiments were performed). (D–F) CAR–Tregs with different signaling domains were pooled and expanded in the presence of anti-CD3/anti-CD28 or bead-bound Dex; (A) LNGFR expression was analyzed at different time points (n = 5–7, two to three different experiments were performed). (E,F) Expression (relative to GAPDH) of the different signaling domains with CD3ζ was determined at different time points of expansion with (E) bead-bound Dex or (F) anti-CD3/anti-CD28. Expression was quantified by qPCR and normalized to relative expression on d0 (n = 7, three different experiments were performed). Statistical significances were determined by (A) Kruskal–Wallis test, (B) one-way analysis of variance, or (C) Wilcoxon signed-rank test indicating activation above background. (A–C) Each dot represents one donor, lines indicate (A,C) median, or (B) mean; (D–F) mean ± SEM is shown.

