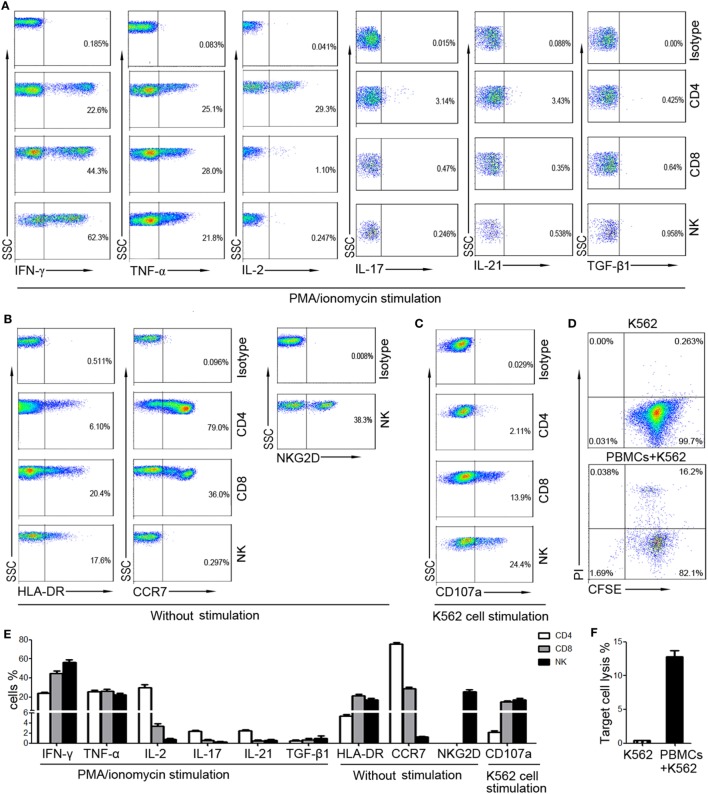
Figure 1.
The expression of different markers on CD4+, CD8+ T cells, and NK cells. Peripheral blood mononuclear cells (PBMCs) were isolated from whole blood of healthy adults (n = 30). (A) Isolated PBMCs were incubated with phorbol-12-myristate-13-acetate/ionomycin and the intracellular production of cytokines was analyzed by flow cytometry. Representative FACS plots showing the expression of IFN-γ, TNF-α, IL-2, IL-17, IL-21, and TGF-β1 in CD4+, CD8+ T cells, and NK cells. (B) The expression of HLA-DR and CCR7 on CD4+, CD8+ T cells, and NK cells and the expression of NKG2D on NK cells were analyzed without stimulation. Representative FACS plots showing the expression of HLA-DR, CCR7, and NKG2D on different subsets of lymphocytes. (C) PBMCs incubated with K562 cells were analyzed for the expression of CD107a. Representative FACS plots showing the expression of CD107a on CD4+, CD8+ T cells, and NK cells. (D) PBMCs were incubated with CFSE-labeled K562 cells and the cytotoxicity of PBMCs was analyzed. Representative FACS plots showing the spontaneous lysis of target cells and the lysis of target cells incubated with PBMCs. (E) Bar graphs showing the percentages of IFN-γ+, TNF-α+, IL-2+, IL-17+, IL-21+, TGF-β1+, HLA-DR+, CCR7+, and CD107a+ cells in CD4+, CD8+ T cells, and NK cells, respectively. The percentage of NKG2D+ cells in NK cells was also shown. Data are shown as mean ± SEM. (F) Bar graphs showing the percentages of lysed target cells in different groups. Data are shown as mean ± SEM.

