Figure 6.
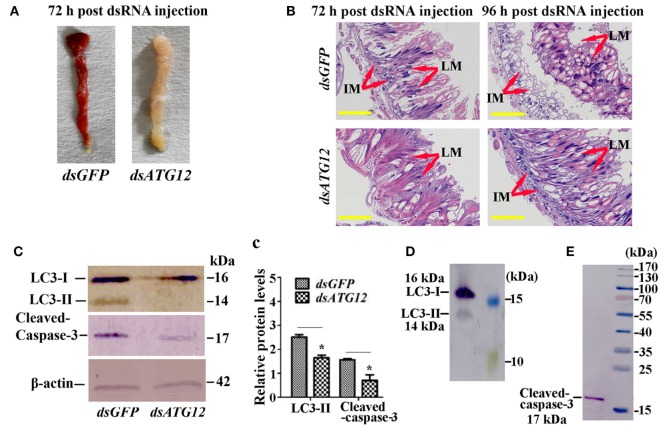
Knockdown of ATG12 delayed midgut programed cell death. (A) The phenotype of the midgut 72 h after dsATG12 (1 µg) injection to sixth instar 6 h larvae. (B) Hematoxylin and eosin staining shows the midgut structure 72 and 96 h after dsGFP and dsATG12 injection, respectively. (C) Levels of the indicated proteins in the midgut after ATG12 knockdown using antibodies against H. armigera LC3 and β-actin; cleaved Caspase-3 was detected with the “anti-mammalian” Caspase-3 antibody. (c) Statistical analysis of the data in (C). Bars represent mean ± SD of three independent experiments; significance of differences determined by Student’s t-test: *p < 0.05; **p < 0.01. (D,E) The specificity of the antibodies and molecular weight of LC3 and Caspase-3. The standard molecular masses of the proteins are same as in Figure 1A.

