Figure 2.
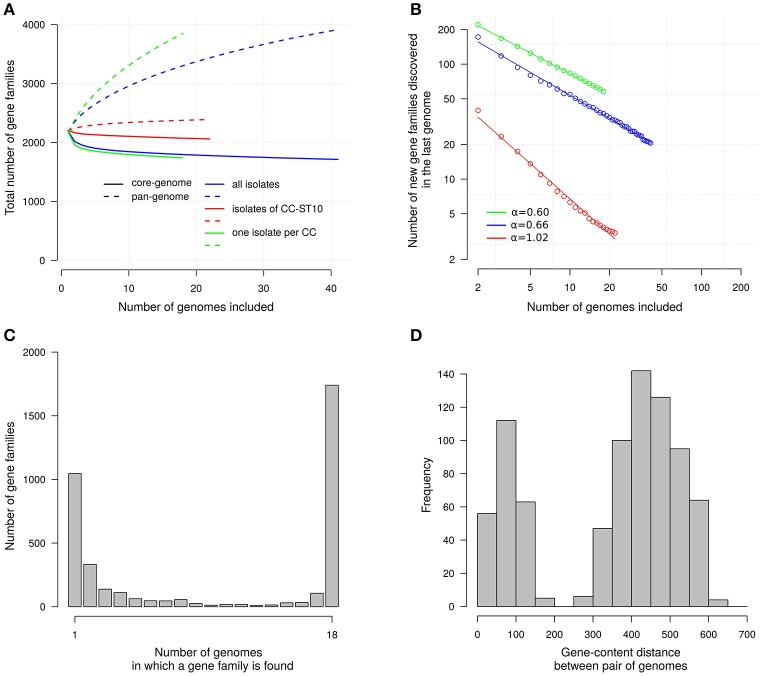
Gene families. (A) Accumulation curves for the sizes of the core- and pan-genomes. Core-genome size, number of gene families in common; Pan-genome size, total number of gene families. Number averaged on 10,000 randomized orders for genome addition. Only gene families of which one member has a length above 100 aa are represented. Colors distinguish curves for three sets of isolates: the 41 isolates considered in this study (blue), the 18 isolates obtained when taking only one representative per clonal complex (green), and the 22 isolates of CC-ST10 (red). (B) Fit of the power-law on the number of new gene families discovered in the last genome added; α is the scaling exponent corresponding to the slope in this log-log representation. Same colors as in (A). (C) Gene frequency spectrum. Only one representative per CC is considered. (D) Distribution of gene-content distances between pairs of genomes.

