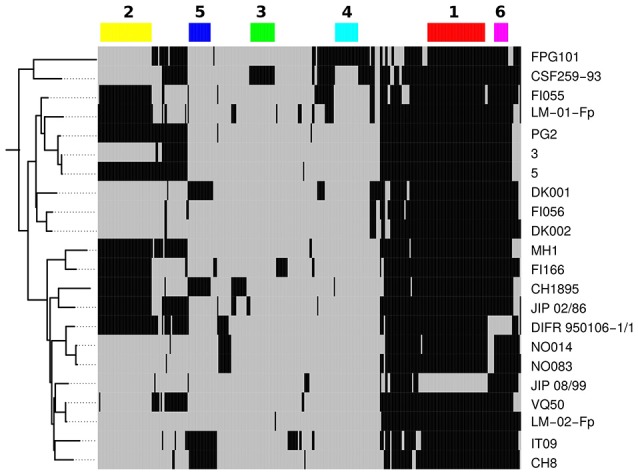
Figure 4.

Variable gene pool of CC-ST10. A total of 330 gene families are represented here. Black indicates presence and gray absence in a particular genome. Genomes are ordered vertically according to the tree built on AT-profiles. Genes are arranged horizontally according to their presence/absence profile as obtained by hierarchical clustering based on Manhattan distance and complete link (not shown). The six major profiles are represented by color rectangles and numbered.
