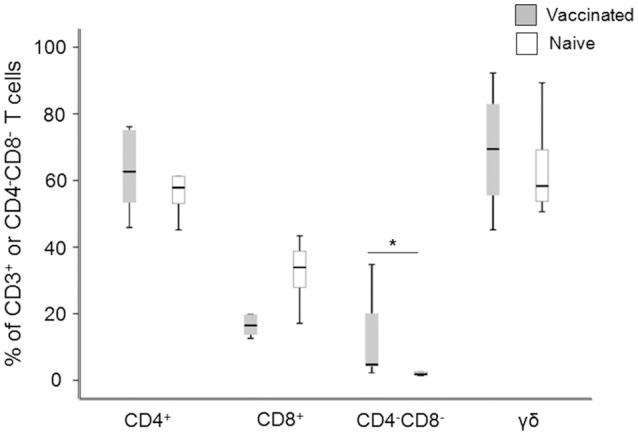
Figure 1.

Flow cytometry analysis of the composition of the non-adherent cells after 6 d of antigen stimulation. The values for the CD4+, CD8+, and CD4−CD8− cells are expressed as percentages of the total number of CD3+ T cells and the values for γ/δ T cells are expressed as percentages of the total number of CD4−CD8− T cells. Levels of CD4−CD8− T cells were significantly higher in vaccinees compared to naïve individuals (*P < 0.05). The line through each box shows the median, with quartile one and three as the lower and upper limits of each box. The end of the vertical lines indicates maximum and minimum values, respectively.
