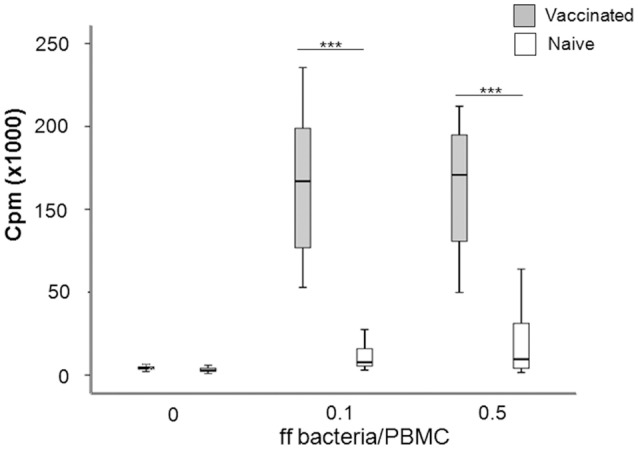
Figure 2.

Box plot showing the proliferative responses of PBMC from naïve and vaccinated donors to recall antigen stimulation. Proliferation was measured by incorporation of [3H]-thymidine upon stimulation with indicated concentrations of ff bacteria/PBMC for 5 days (***P < 0.0001). The line through each box shows the median, with quartile one and three as the lower and upper limits of each box. The end of the vertical lines indicates maximum and minimum values, respectively.
