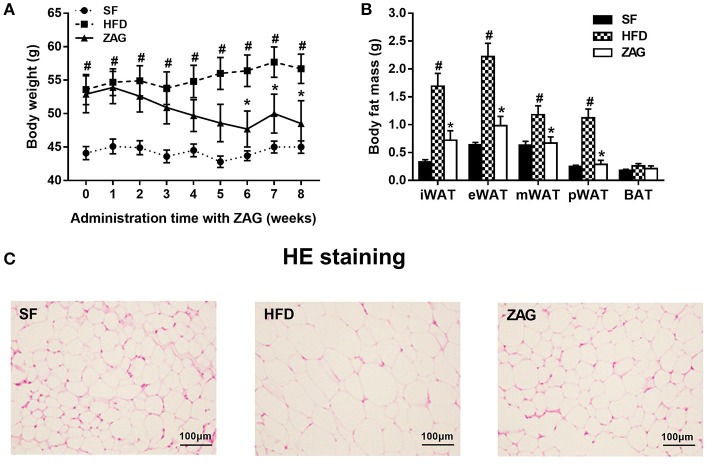
Figure 2.
Effects of ZAG overexpression on body weight (A) and body fat (B) in HFD-induced obese mice. (C) Sections of inguinal WAT stained with hematoxylin and eosin. Data are presented as the mean ± s.e.m. SF n = 10, HFD n = 13, ZAG n = 8. iWAT, inguinal white adipose tissue; eVAT, epididymal visceral adipose tissue; mVAT, mesenteric visceral adipose tissue; pVAT, perirenal visceral adipose tissue; BAT, brown adipose tissue. #P < 0.05 vs. SF; *P < 0.05 vs. HFD.

