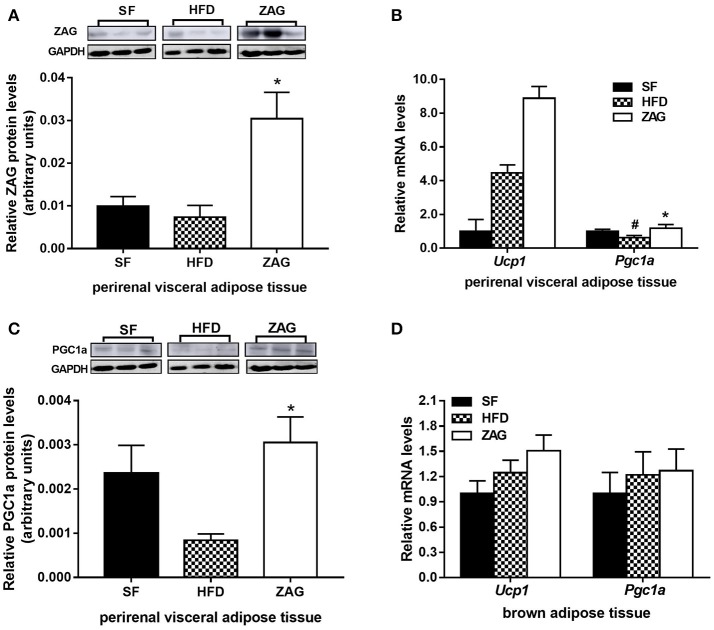
Figure 5.
Effects of ZAG on the expression of WAT browning-related genes in pVAT and BAT in HFD-induced obese mice. (A) The protein levels of ZAG in mouse pVAT. (B) The mRNA levels of Pgc1a and Ucp1 in mouse pVAT. (C) The protein levels of PGC1α in mouse pVAT. (D) The mRNA levels of Pgc1a and Ucp1 in mouse BAT. For the western blots shown in (A) and (C), the relative integrated density of each protein band was quantified using the program ImageJ with GAPDH as the internal control. Three representative protein band figures were shown. Data are presented as the mean ± s.e.m. SF n = 10, HFD n = 13, ZAG n = 8. pVAT, perirenal visceral adipose tissue; BAT, brown adipose tissue; ZAG, zinc-α2-glycoprotein; UCP1, uncoupling protein 1; PGC1α, peroxisome proliferator-activated receptor gamma coactivator 1 alpha. #P < 0.05 vs. SF; *P < 0.05 vs. HFD.

