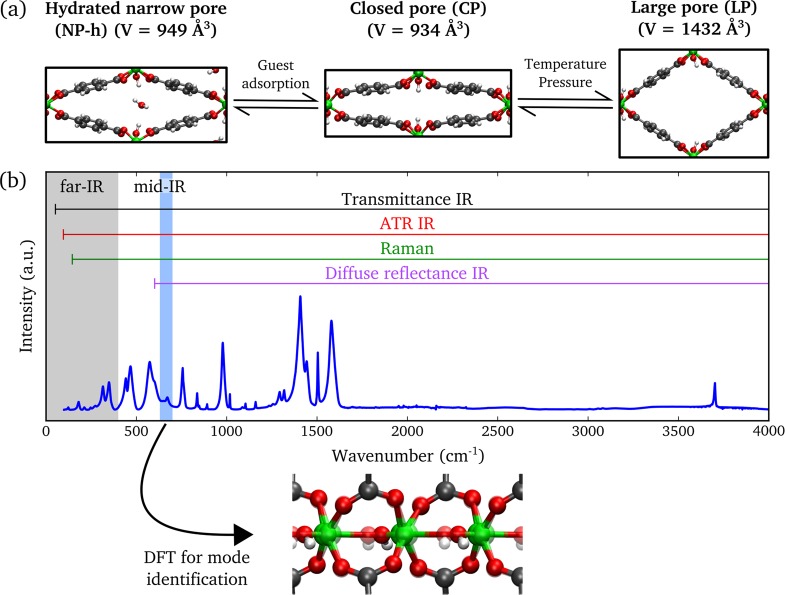
Figure 1.
(a) Illustration of the different crystal structures of MIL-53(Al) with corresponding unit cell volumes (volumes were taken from refs (18) and (21)). (b) Schematic representation of the applied experimental techniques with respective spectral ranges that can be probed by these techniques. Static and dynamic DFT simulations have been used to identify the observed IR- and Raman-active vibrational modes, respectively.

