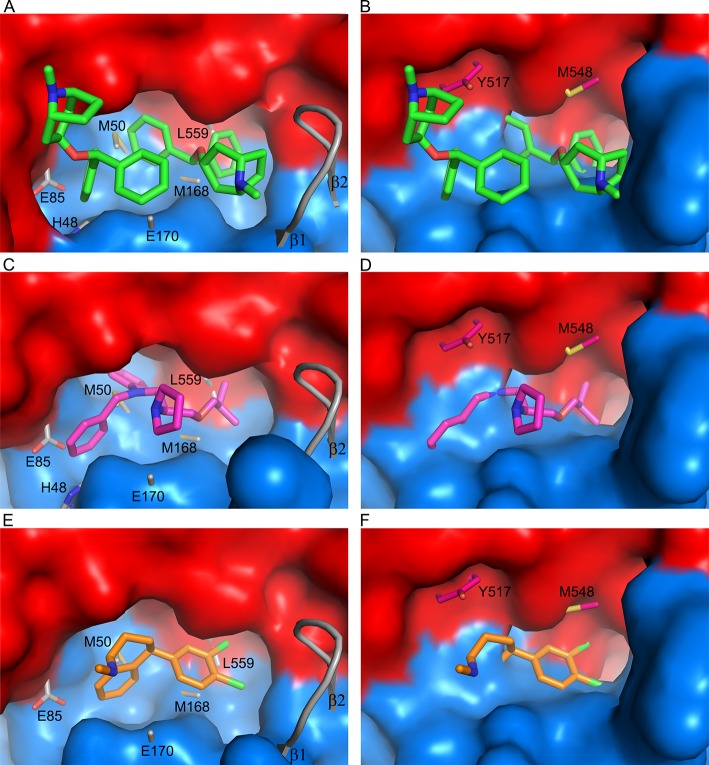
Figure 7.
Differences between EBOV and MARV GPs at the inhibitor binding site. Superpositions of the inhibitor binding sites of EBOV GP–benztropine (A,B), GP–bepridil (C,D) and GP–sertraline (E,F) with that of MARV GP. In (A), (C, ) and (E), EBOV GPs are shown as surface representations, inhibitors as sticks, with MARV GP main-chain as gray ribbon and side-chains as gray sticks with labels. In (B), (D), and (F), MARV GP (excluding residues 172–180) is shown as a surface representation, with the EBOV GP complexes shown as ribbons and sticks and side-chains of EBOV GP labeled.

