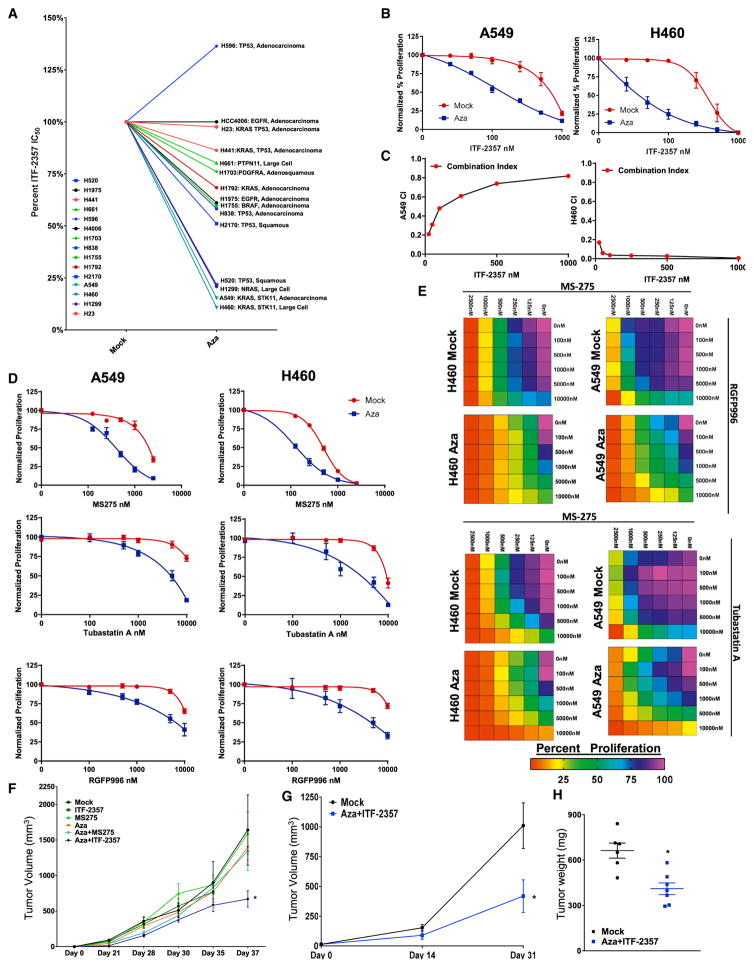
Figure 1. Azacitidine Synergizes with Sequential HDACi for Reducing Cell Proliferation.
(A) Composite representation of ITF-2357 IC50 as determined by four parameter dose-response analysis in the presence of mock or 500 nM Aza pre-treatment. Individual dose-response curves are in Figures 1B, S1B, and S1E. H1650 not depicted due to lack of sensitivity to epigenetic agents deployed in study.
(B) Sequential treatment with (mock or 500 nM Aza) + ITF-2357 log dose-response curves for growth inhibition of A549 and H460 cells (day 11, n = 5, data represented as mean ± SEM).
(C) Combination index (CI) plots for sequential application of Aza + ITF-2357 in A549 and H460 cells (n = 5).
(D) Sequential treatment with (mock or 500 nM Aza) + MS-275, RGFP996 (HDAC3i), or Tubastatin A (HDAC6i) log dose-response curves for growth inhibition of A549 and H460 cells (day 11, n = 3, data represented as mean ± SEM).
(E) Sequential treatment (mock or 500 nM Aza) with MS-275 plus either RGFP996 or Tubastatin A drug dose-response matrix for growth inhibition of A549 and H460 cells (day 11, n = 3, color gradation indicates percentage viability at the indicated dose combination).
(F and G) Mean volumes of tumor xenografts obtained from NOD-SCID mice subcutaneously injected with H460 cells (F) or H1299 cells (G) and treated with the agents as indicated in the figure. Data are presented as mean ± SEM (n = 5). *p < 0.05 calculated using two tailed t test.
(H) Tumor weights for patient-derived xenografts treated with the agents as outlined in the figure (28 days of treatment duration; data are presented as mean ± SEM; n = 6 mock and n = 7 Aza + ITF-2357). *p value < 0.05 calculated using two-tailed t test.
See also Figure S1.

