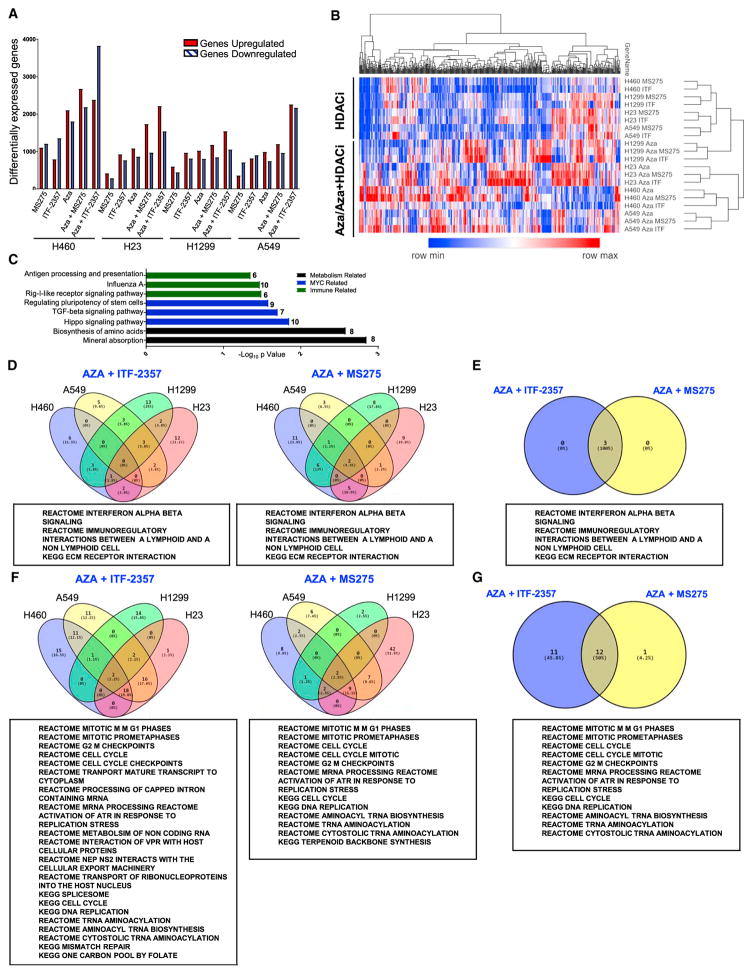
Figure 2. Epigenetic Treatment of NSCLC Cell Lines Induces Robust Alteration of Cell Transcriptome.
(A) Quantitation of differentially expressed genes (cutoff Log2 fold change over mock >0.5) for each treatment condition.
(B) Unsupervised hierarchical clustering of relative RNA expression by median absolute deviation (MAD). RNA expression Log2 fold change over mock; blue to red color gradation is based on the ranking of each condition from minimum (blue) to maximum (red). The top 500 genes are depicted.
(C) DAVID analysis of the top 500 MAD genes using Kyoto Encyclopedia of Genes and Genomes (KEGG) gene ontology.
(D) Venn diagrams depicting GSEA-derived overlapping and unique pathways induced by combination treatment in at least 3 cell lines with the respective HDACi (normalized enrichment score [NES] > 2.0, false discovery rate [FDR] < 0.25).
(E) Venn diagram of pathways commonly upregulated by combination treatment with Aza and the respective HDACi.
(F) Venn diagrams depicting GSEA-derived overlapping and unique pathways downregulated by combination treatment in at least 3 cell lines with the respective HDACi (NES < 2.0, FDR < 0.25).
(G) Venn diagram of pathways commonly downregulated by combination treatment with Aza and the respective HDACi.
The above data are derived from microarray analysis of RNA from cells treated with 500 nM Aza, 100 nM ITF-2357, and 100 nM MS-275.
See also Figure S2.

