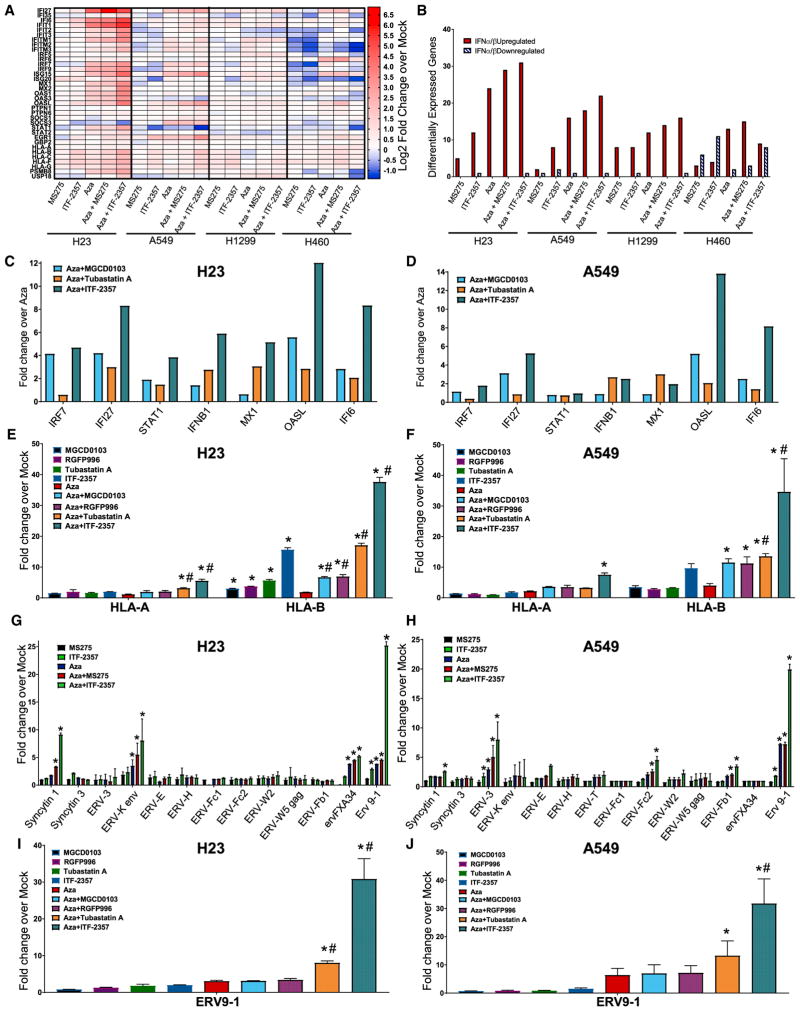
Figure 3. Combination Epigenetic Treatment Augments IFNα/β Pathway-Associated Immune Genes and ERV Transcription.
(A) Heatmap of relative RNA expression for IFNα/β-signaling pathway core-enriched genes for the indicated cell lines (microarray, day 8; 500 nM Aza, 100 nM MS-275, and 100 nM ITF-2357).
(B) Quantification of IFNα/β pathway core-enriched genes differentially expressed by the indicated conditions (microarray, day 8; 500 nM Aza, 100 nM MS-275, and 100 nM ITF-2357; differential gene expression cutoff Log2 fold change over mock >0.5).
(C and D) Expression of viral defense gene subset of IFNα/β pathway (PCR genecard, day 8; 500 nM Aza, 100 nM ITF-2357, 200 nM MGCD0103, and 1,000 nM Tubastatin A) in H23 (C) and A549 (D) cells.
(E and F) Quantitation of selected major histocompatibility complex (MHC) class I genes of the IFNα/β pathway in response to Aza and/or HDACi in H23 (E) and A549 (F) cells (qRT-PCR, day 8; 500 nM Aza, 100 nM ITF-2357, 200 nM MGCD0103, 2,000 nM RGFP996, and 1,000 nM Tubastatin A; n = 3).
(G and H) Quantitation of ERV transcripts in response to Aza and/or HDACi in H23 (G) and A549 (H) cells (qRT-PCR, day 8; 500 nM Aza, 100 nM ITF-2357, and 100 nM MS-275; n = 4).
(I and J) Quantitation of ERV9-1 in response to Aza and/or HDACi in H23 (I) and A549 (J) cells (500 nM Aza, 100 nM ITF-2357, 200 nM MGCD0103, 2,000 nM RGFP996, and 1,000 nM Tubastatin A; n = 3).
Data are presented as mean ± SEM (*p < 0.05 relative to mock and #p value < 0.05 relative to Aza; p value determined by two-tailed t test).
See also Figures S3 and S4.

