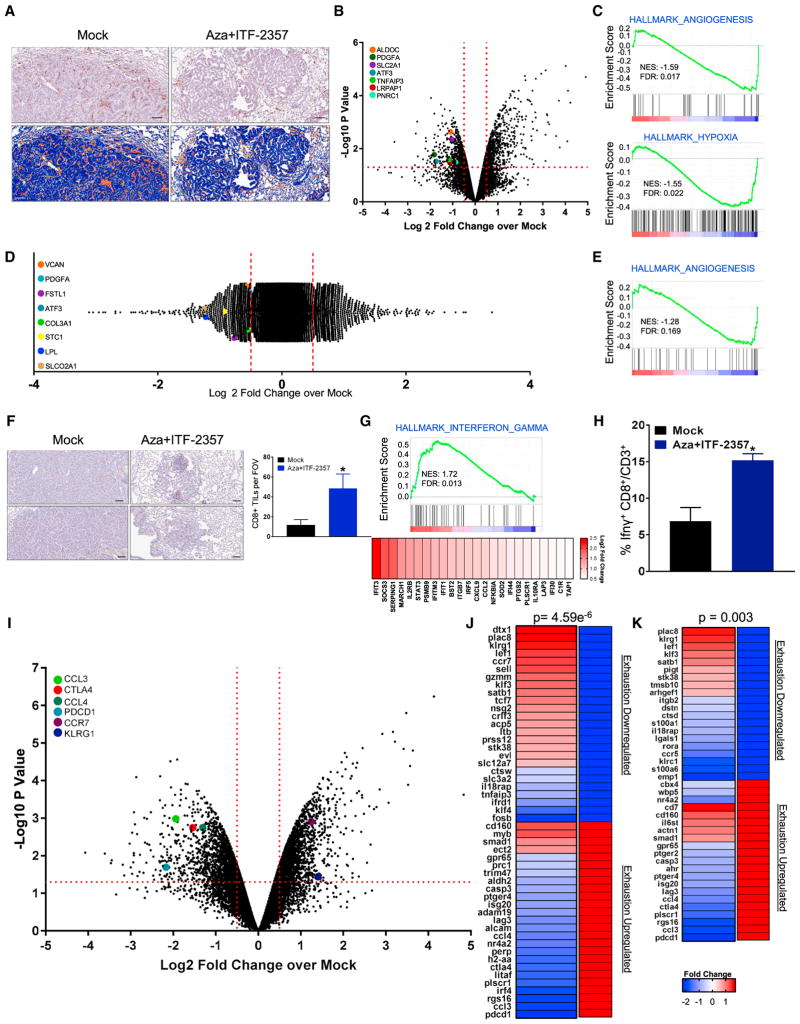
Figure 6. Effect of Combination Epigenetic Treatment on Tumor-Associated Immune Populations and Their Functional Status.
(A) Representative IHC staining of F4/80+ macrophages in LSL-KrasG12D lung tumor sections treated with mock or Aza + ITF-2357 for 3 months. Upper panel: representative F4/80+ IHC. Lower panel: positive pixel transformation of IHC images in upper panel using Aperio Imagescope software. Scale bar, 100 μm.
(B) Volcano plot of relative RNA expression of CD45+CD11b+F4/80hi macrophages sorted via FACS and isolated from tumor-bearing lungs from 3-month mock- or Aza + ITF-2357-treated LSL-KrasG12D mice. Genes in the upper left and right quadrants are significantly differentially expressed (microarray, n = 2 per group). Hypoxia- and angiogenic pathway-associated genes are highlighted.
(C) Key affected pathways obtained from GSEA of CD45+CD11b+F4/80hi macrophage RNA isolated from tumor-bearing lungs from 3-month Aza + ITF-2357-treated LSL-KrasG12D mice as compared to mock-treated mice.
(D) Log2 fold relative RNA probe distribution showing differential gene expression from bone marrow-derived macrophages (BMDMs) treated in vitro with mock or Aza + ITF-2357. Angiogenic pathway-associated genes are highlighted (microarray, BMDM data representative of n = 3 mice).
(E) GSEA enrichment plot for angiogenesis pathway from BMDM RNA expression.
(F) CD8+ IHC in lung tumors of mock- and Aza + ITF-2357-treated LSL-KrasG12D mice following 3 months of treatment (scale bar, 100 μm). The graph on the right indicates the average number of CD8+ T cells counted per field of view (FOV) intra-tumor for mock and treated mice (n = 6 mock and n = 7 Aza + ITF-2357 mice).
(G) Relative RNA expression-based enrichment plot for hallmark interferon gamma response gene set in tumors from LSL-KrasG12D mice treated with mock and Aza + ITF-2357. Color gradation is representative of Log2 fold change over mock RNA expression (microarray, n = 2 per group).
(H) Percentage IFNγ+ CD8+/CD3+ TILs by FACS in LLC subcutaneous tumors from 1-month mock- and Aza + ITF-2357-treated mice.
(I) Volcano plot of relative RNA expression for CD45+CD3+CD8+ FACS-obtained lymphocytes isolated from tumor-bearing lungs of 3-month Aza + ITF-2357-treated LSL-KrasG12D mice as compared to mock mice. Genes in the upper left and right quadrants are significantly differentially expressed (microarray, n = 2 per group). Highlighted genes are involved in T cell fate determination.
(J and K) Fold change in expression of selected differentially expressed genes in FACS-obtained T cells from 3-month Aza + ITF-2357-treated mice. Genes shown are those that overlapped with exhaustion versus memory signatures (J) or exhaustion versus effector signatures (K) queried from Wherry et al. (2007) as defined in the Results. Genes on the left of each panel were differentially expressed by Aza + ITF-2357 and directionality in the gene set queried is on the right (red, upregulated; and blue, downregulated. The associated p value for the probability of overlap as derived by hypergeometric probability calculation is depicted above each panel. See also Figure S6.

