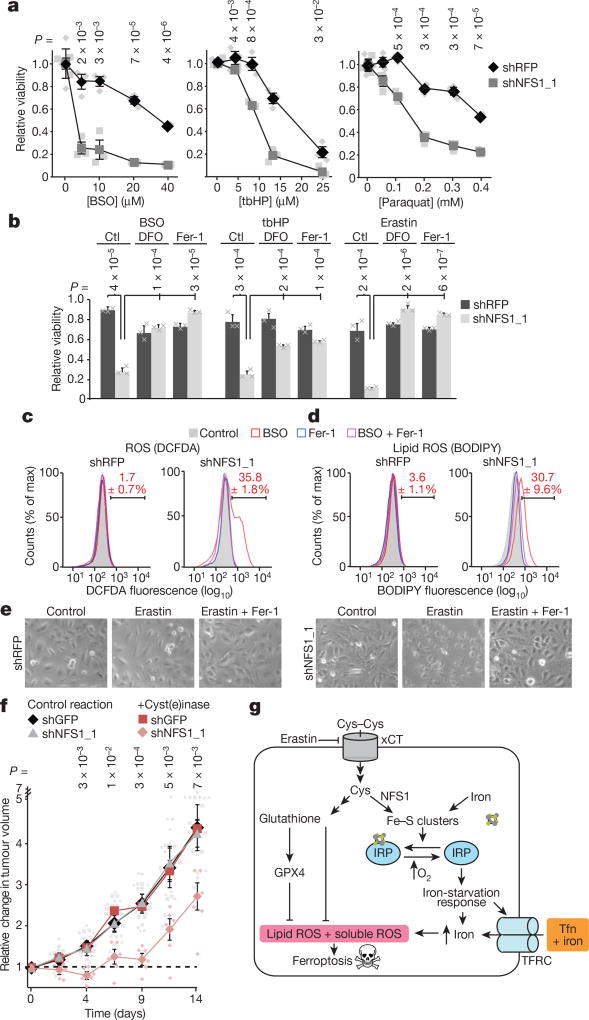
Figure 4. Suppression of NFS1 predisposes cancer cells to ferroptosis.
a, Relative viability (2 days, 3% O2) of MDA-MB-231 cells, expressing shRFP or shNFS1_1, treated with varying concentrations of BSO, tbHP or paraquat. Data are from three biologically independent replicates. b, Relative viability (2 days, 3% O2) of cells from a treated with BSO (5 µM), tbHP (10 µM) or erastin (2.5 µM) and deferoxamine (DFO, 100 µM), Fer-1 (1 µM) or no treatment control (ctl). Data are from three biologically independent triplicates. c, d, Relative DCFDA (c) or BODIPY (d) fluorescence measured by flow cytometry of MDA-MB-231 cells from a, after 48 h treatment with either BSO (20 µM), Fer-1 (1 µM) or both. Red text indicates the percentage ± s.e.m. cells in the bracketed region. Data are from three biological replicates. e, Representative images from triplicate experiments, overnight erastin (5 µM), Fer-1 (1 µM). f, MDA-MB-231 tumour growth. Once palpable (day 0), animals were treated every 3 days (50 mg kg−1 PEG-cyst(e)inase). Change in volume reported, caliper measurement. Data are from six independent replicate tumours. g, Schematic of the proposed model. NFS1 suppression results in loss of IRP ISCs, upregulation of iron-starvation response (increased transferrin receptor (TFRC), decreased ferritin), and increased free intracellular iron. High iron promotes ferroptosis by increasing lipid peroxidation. a, b, f, Data are mean ± s.e.m., P values obtained by heteroscedastic two-sided t-test. Tfn, transferrin; xCT, cystine-glutamate antiporter.

