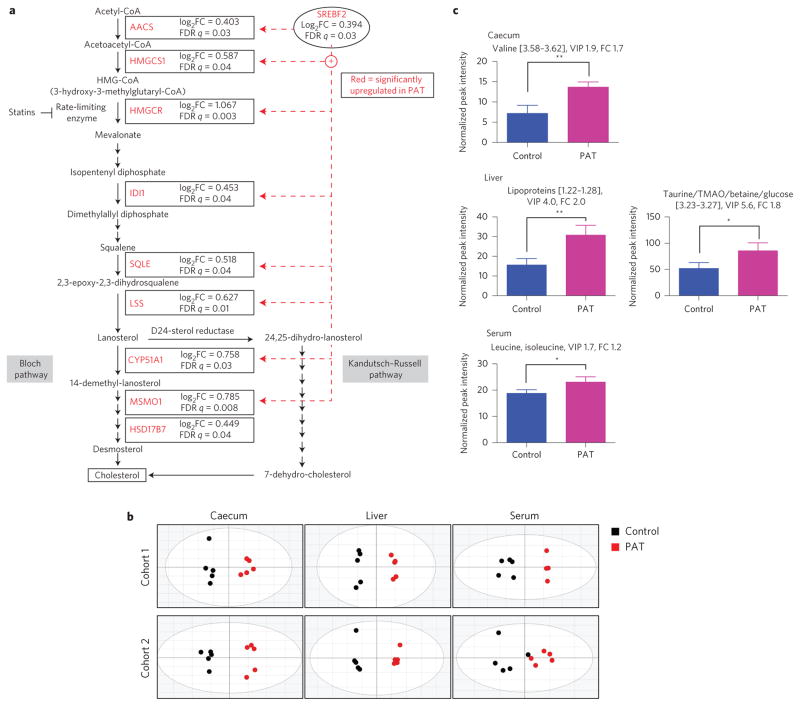
Figure 3. PAT alters metabolic gene expression pathways as well as metabolite composition in caecum, liver and serum.
Analyses were performed on 6-week-old male control and PAT NOD mice (biological replicates). a, PAT increases the expression of ileal genes involved in cholesterol biosynthesis. Microarray analysis as described in Fig. 2. Ingenuity pathway analysis was performed to identify differentially regulated gene pathways. Acetoacetyl-CoA synthetase, AACS; HMG-CoA synthase 1, HMGCS1; HMG-CoA reductase, HMGCR; isopentenyl diphosphate isomerase 1, IDI1; squalene epoxidase, SQLE; lanosterol synthase, LSS; lanosterol 14 α-demethylase, CYP51A1; methylsterol monooxygenase 1, MSMO1; 17-β-hydroxysteroid dehydrogenase, HSD17B7. b, Metabolomic composition in caecal, liver and serum samples of control and PAT mice. Score plots of OPLS-DA analysis of caecal, liver and serum samples show separation of PAT (black circles, left) from control mice (red circles, right). The statistics for the model fits of the OPLS-DA: caecal samples: [Cohort 1, R2X = 0.912, R2Y = 0.968, Q2 = 0.892; Cohort 2, R2X = 0.952, R2Y = 0.972, Q2 = 0.906]; liver samples: [Cohort 1, R2X = 0.859, R2Y = 0.992, Q2 = 0.956; Cohort 2, R2X = 0.886, R2Y = 0.991, Q2 = 0.891]; serum samples: [Cohort 1, R2X = 0.734, R2Y = 0.953, Q2 = 0.776; Cohort 2, R2X = 0.732, R2Y = 0.758, Q2 = 0.120]. c, Select differential metabolites (using NMR bin intensities) in caecum, liver and serum of control and PAT mice. Error bars represent mean + s.d.

