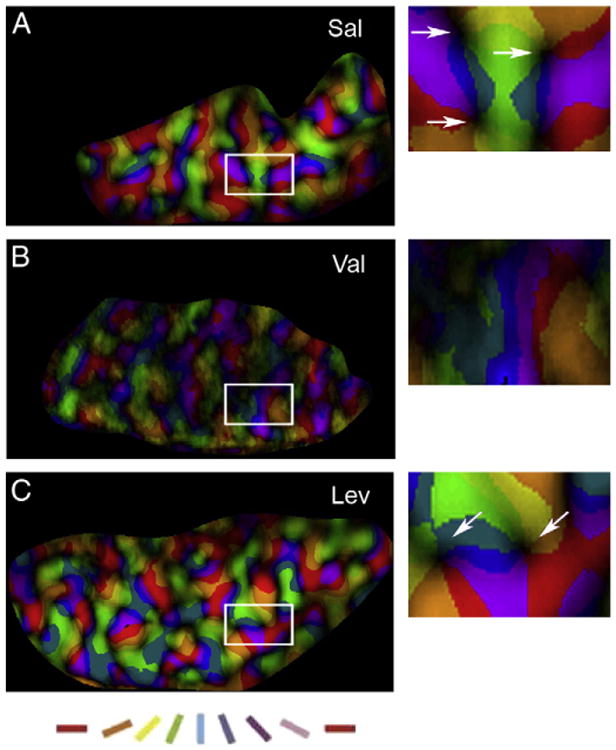
Fig. 3.

Early exposure to Val disrupts the organization of polar maps. Polar magnitude maps (left column) of Sal- Val- and Lev-treated animals (A, B, and C respectively), where brightness indicates degree of selectivity, and colors represent different orientations. Note that both Sal- and Lev-treated animals present an even representation of colors and a great number of “pinwheels” (arrows, insets). In contrast the Val-treated animals present an uneven representation of colors and do not show “pinwheels” as Sal and Lev-treated animals. Scale bar, 2.5 mm. The right column shows representative pinwheel centers (arrows) from polar maps shown in the left column.
