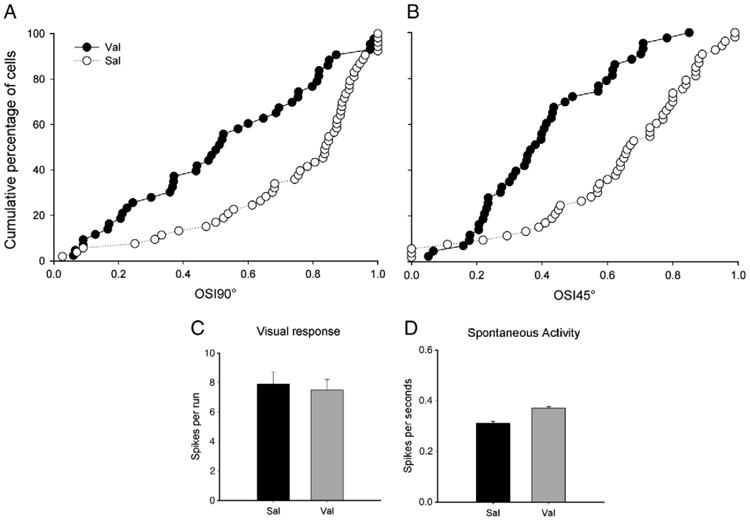
Fig. 4.

Early exposure to Val disrupt orientation selectivity at the neuronal level. Cumulative percentage of cells is plotted as a function of an orientation selectivity index (OSI, see Methods section) 90° (A) and 45° (B) in Sal (n = 53 cells, from 4 animals) and Val (n = 44 cells, from 4 animals) treated animals. In these charts, OSI values close to 0 and 1 indicate, respectively, lower or higher degrees of orientation selectivity. Note that the distribution of cells in Val-treated animals is skewed to the left indicating a higher proportion of poorly selective cells. In contrast, Sal-treated animals have their distribution skewed to the right indicating a higher proportion of highly selective cells. Note that, similar results were obtained with both indexes used (90° and 45°). C. Visual responses of striate cortical cells to a moving bar of light at the optimal orientation. Similar mean maximal response (in spikes per run) of cortical neurons to stimulation at the optimal orientation observed in Val and Sal-treated animals (P>0.05 in each case). These findings indicate that Val exposure preserved robust responses to visual stimulation. D. The average number of spikes registered when the stimulating bar was not moving was the same in Sal and Val animals (P>0.05 in each case). This finding indicates that Val exposure did not affect spontaneous activity in primary visual cortex. Bars indicate SE.
