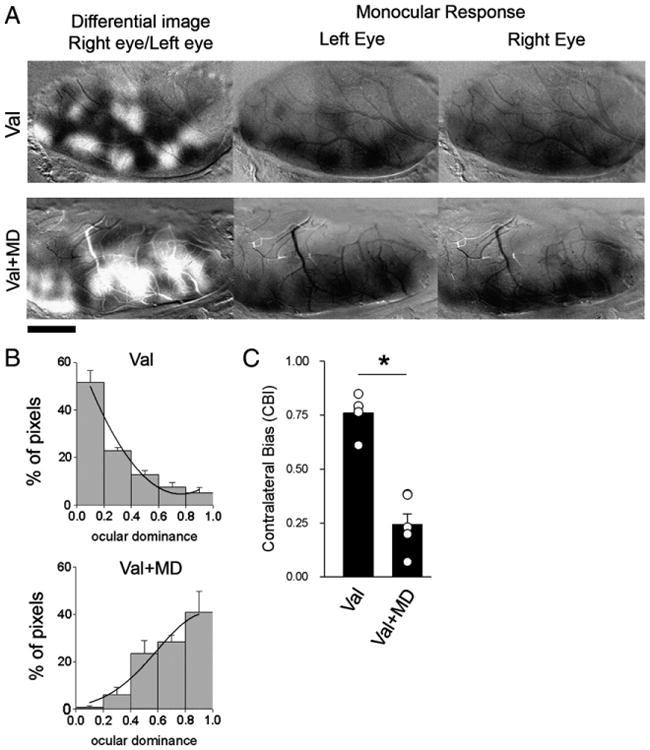
Fig. 8.

Early exposure to Val does not affect ocular dominance (OD) plasticity. A. Effects of monocular deprivation on OD maps, revealed by optical imaging of intrinsic signals. Differential maps are shown on the left column, in which dark areas respond best to gratings presented to the right eye and white areas respond best to stimulation of the left eye. Monocular response maps for the left and right eye stimulation are shown on the center and right columns, respectively. Dark areas in the monocular response maps represent visual responses. All images are from the left hemisphere, with medial represented to the right and rostral to the top of the figure. Note that, after MD was observed a predominance of light pixels in the differential map, reflecting a shift in dominance towards the left (nondeprived) eye. B. Histograms display the percentage of pixels fitting in a grayscale (0—black, 255—white). Note the predominance of black and gray pixels in Val-treated animals without MD and the predominance of lighter pixels in Val-treated animals after MD; Val (no MD), n = 5; Val + MD, n = 6. C. Mean contralateral bias indexes for both groups. Circles indicate individual animals. After 4 days of MD animals exposed to Val presented significantly lower CBIoiS than nondeprived ones. *P<0.001.
