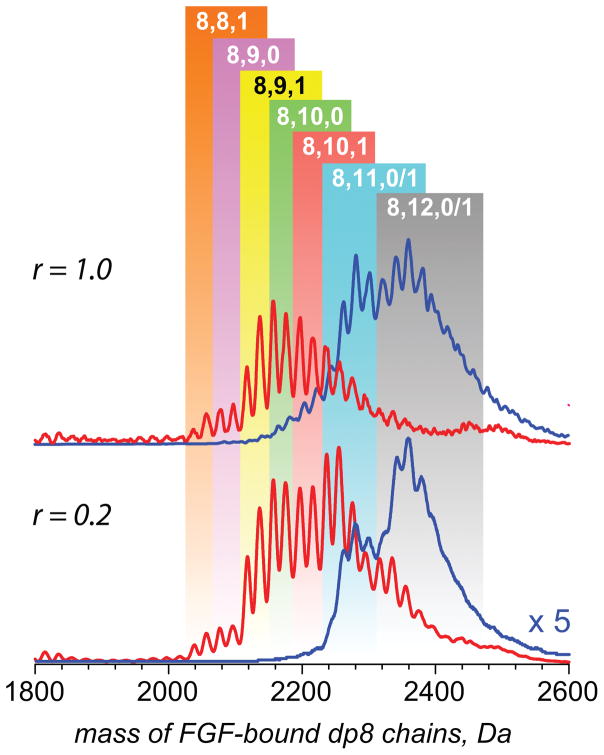
Figure 5.
Mass distributions of the FGF-bound dp8 molecules at two different protein/heparinoid molar ratios. Mass distributions of the dp8 chains involved in formation of 1:1 complexes (red traces) are calculated based on the ionic signal of FGF·dp8+7 species, and those for 2:1 complexes (blue traces) are calculated based on the ionic signal of FGF2·dp8+12 species. The colored boxes indicate the mass ranges corresponding to the dp8 species with varying levels of sulfation.

