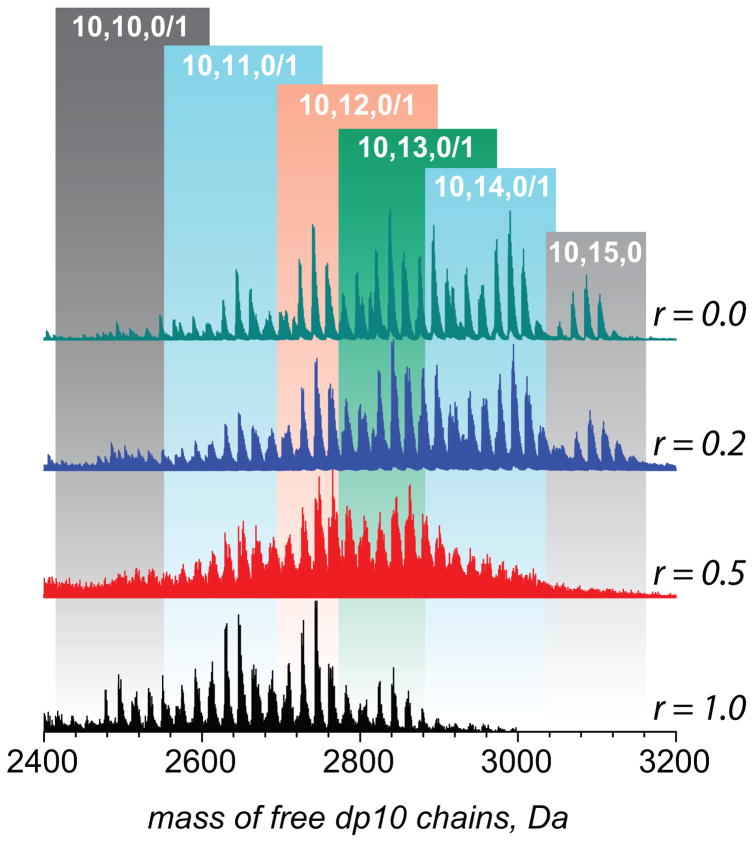
Figure 7.
Mass distributions of free dp10 molecules in solution in the absence (green trace) and in the presence of FGF-1 (r-values are shown on each panel) calculated based on the ionic signals of FGF+2 species in ESI mass spectra. The colored boxes indicate the mass ranges corresponding to the dp10 species with varying levels of sulfation.

