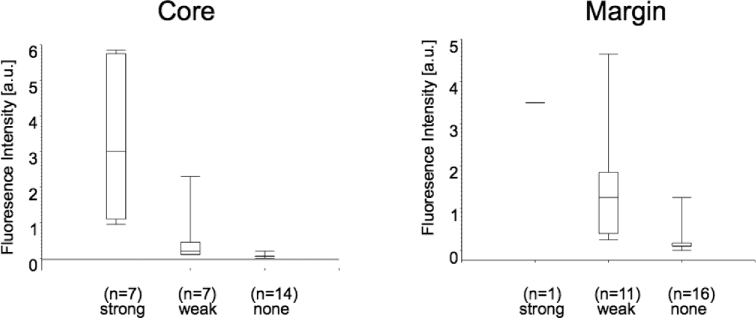
FIGURE 4.
Mean fluorescence intensities as measured spectrometrically vs fluorescence quality (strong, weak, none) in tumor core. Box plots signify minimum, first quartile, median, third quartile, and maximum. Jonckheere–Terpstra test: P < .0001; Wilcoxon–Mann–Whitney test: none vs weak fluorescence: P = .0001; weak vs strong: P = .002; none vs strong: P < .0001.

