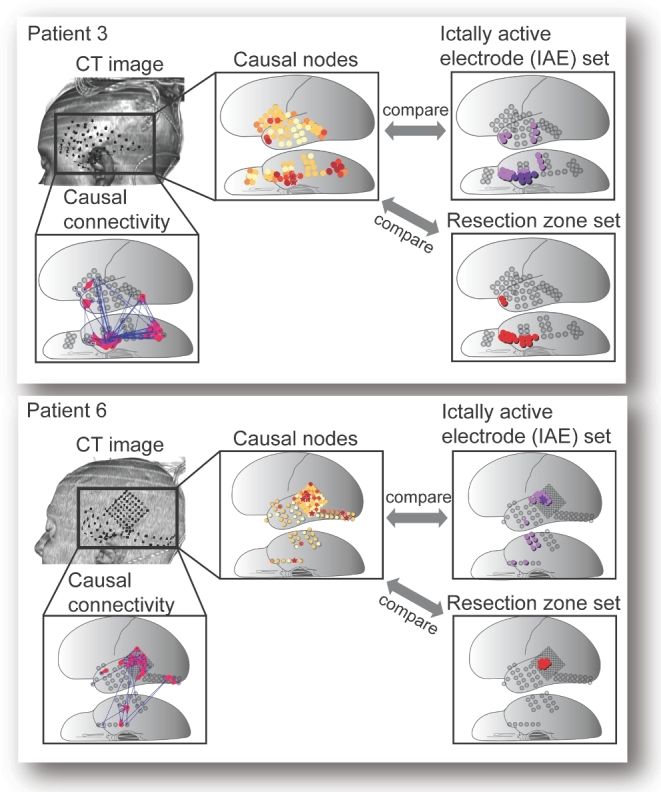
FIGURE 4.

Some cases showed remarkable similarity between the high-causality electrodes and the IAE set. Two of those patients (patient 3 and patient 6) who showed excellent concordance between high causal nodes and the IAE (P = .009 and P = .003 by rank order, respectively) are shown. The volume-rendered CT images and the causal connectivity maps of the patients are shown. The rank-ordered and color-coded causal nodes obtained from GC analysis can be visually as well as statistically compared (by calculating rank order sum and Cartesian distance) with the IAE set and with the RZ.
