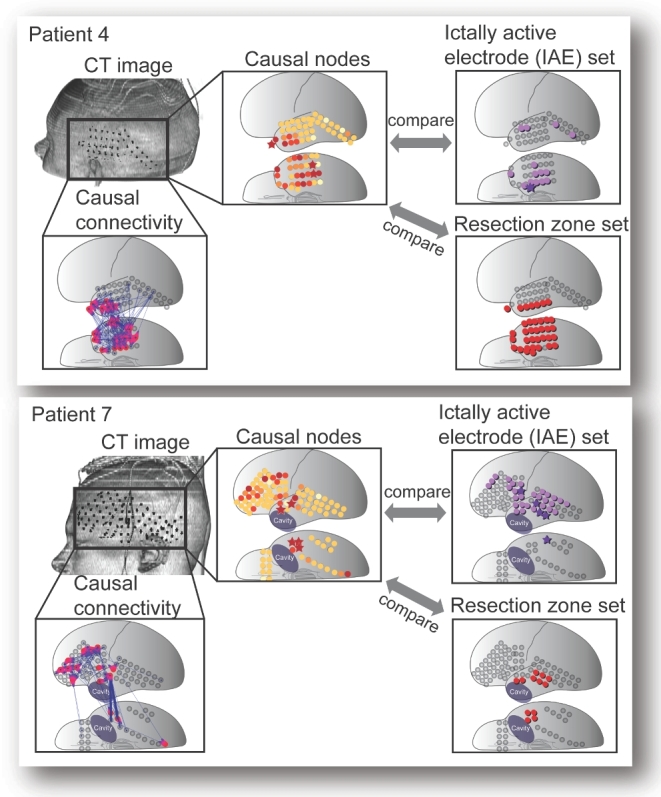
FIGURE 5.

Several cases showed poor similarity to the IAE set. Two of such cases (patient 4 and patient 7) with weaker statistical correlation between high causal nodes and the IAE (P = .06 and P = .70, respectively) are shown, arranged as in Figure 4. The volume-rendered CT images and the causal connectivity maps of the patients are shown. The rank-ordered and color-coded causal nodes obtained from GC analysis can be visually as well as statistically compared (by calculating rank order sum and Cartesian distance) with the IAE and with the RZ. In patient 4, the most causal nodes clearly suggest the temporal lobe, though with less emphasis on the small focus of onset observed in the ictal iEEG. The high-causality nodes virtually all resided within the resection. In patient 7, where monitoring was done around a previous resection cavity, the causality map pointed to a broader region, including much of the lateral frontal lobe. The resection in this particular case included only temporal tissue.
