
Fig 1.
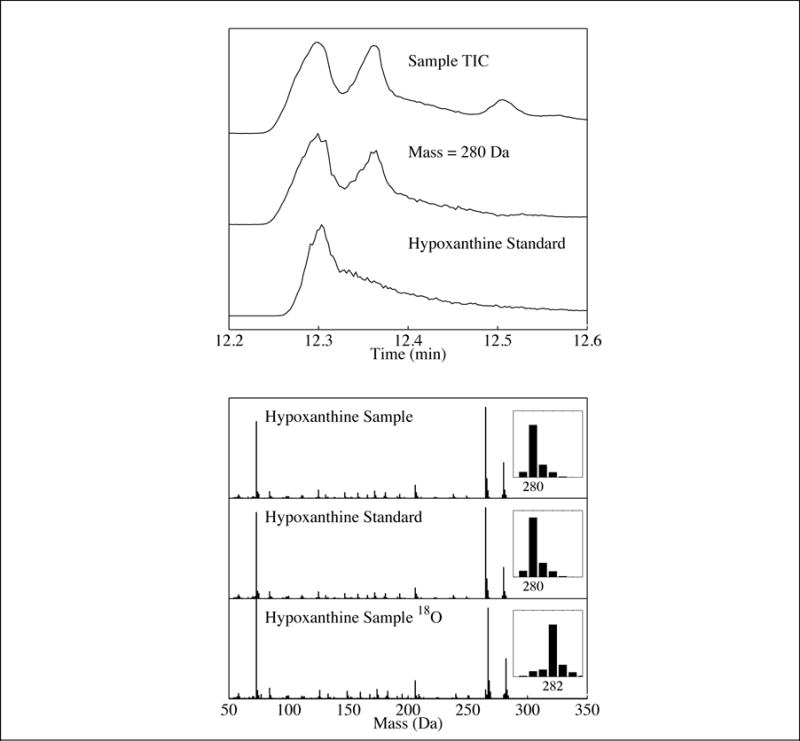
Top panel: (Top Trace) Total-ion chromatogram (TIC) of the residue produced from a UV-irradiated H2O:NH3: purine ice. Middle trace) Single-ion chromatogram (SIC) of the same residue for mass 280 Da. (Bottom trace) SIC of the hypoxanthine standard (mass 280 Da). Bottom panel: (Top trace) Mass spectrum of the peak identified as hypoxanthine in the same residue. (Middle trace) Mass spectrum of the hypoxanthine standard. (Bottom trace) Mass spectrum of the peak identified as hypoxanthine in the residue produced from a UV-irradiated ice containing H218O instead of H2O. The observed mass increase matches what is expected for the hypoxanthine identification.