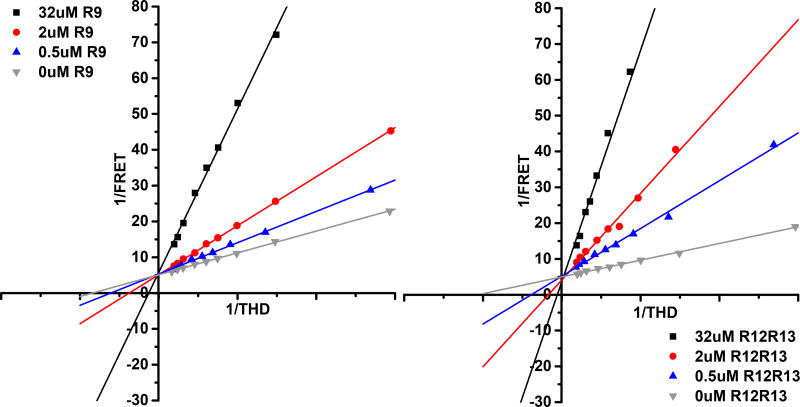
Figure 3.
Linweaver-Burk Plot of fluorescence titrations in the presence of talin rod subdomains. Subdomain concentrations 32 (µM), 2 (µM), 0.5 (µM), and 0 (µM). Panel left – R9 subdomain, Panel right - R1213 subdomain. The shared Y intercepts suggest that both talin rod inhibitory subdomains are competitive inhibitor for talin membrane interactions.

