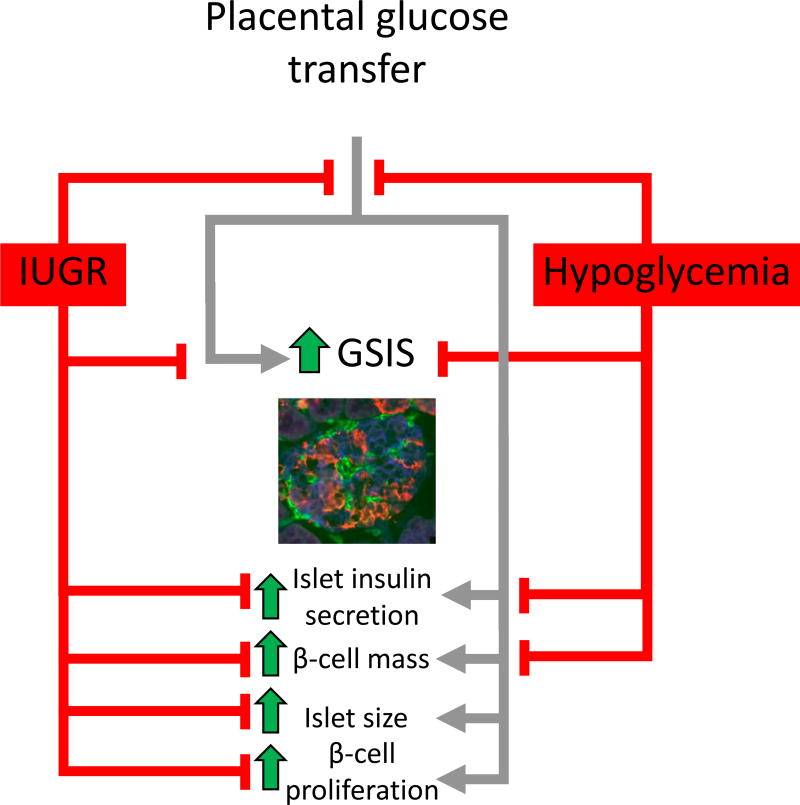
Figure 1. A schematic representation of fetal pancreatic and β-cell dysfunction in models of IUGR and potential mechanisms of glucose regulation for β-cell dysfunction.
The fetal pancreas response to glucose is represented by the gray lines. Pancreatic dysfunctions associated with models of IUGR are depicted by red lines. A fetal sheep islet is at 90% of gestation is depicted in the micrograph and has been immunostained for insulin (β-cell; blue), glucagon+somatostatin+pancreatic polypeptide (red), and vasculature (GS1; green).

