
Extended Data Figure 5. Genomic modifiers of response and outcome by treatment duration.
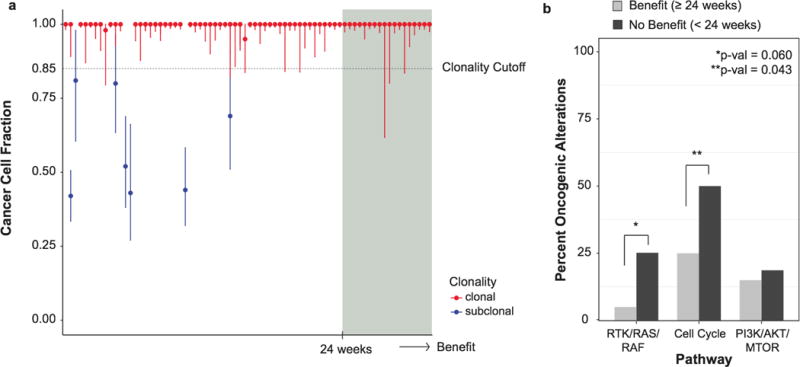
a) Cancer cell fractions with 95% confidence intervals and clonality status of all HER2 mutations in 74 patients with sufficient sequencing data ordered by increasing clinical benefit (weeks on therapy). b) Comparison of the percent activation of known oncogenic alterations in the three pathways between the patients of clinical benefit (n=20, biologically independent samples) and no benefit (n=66, biologically independent samples). Nominal Fisher’s p-values shown.