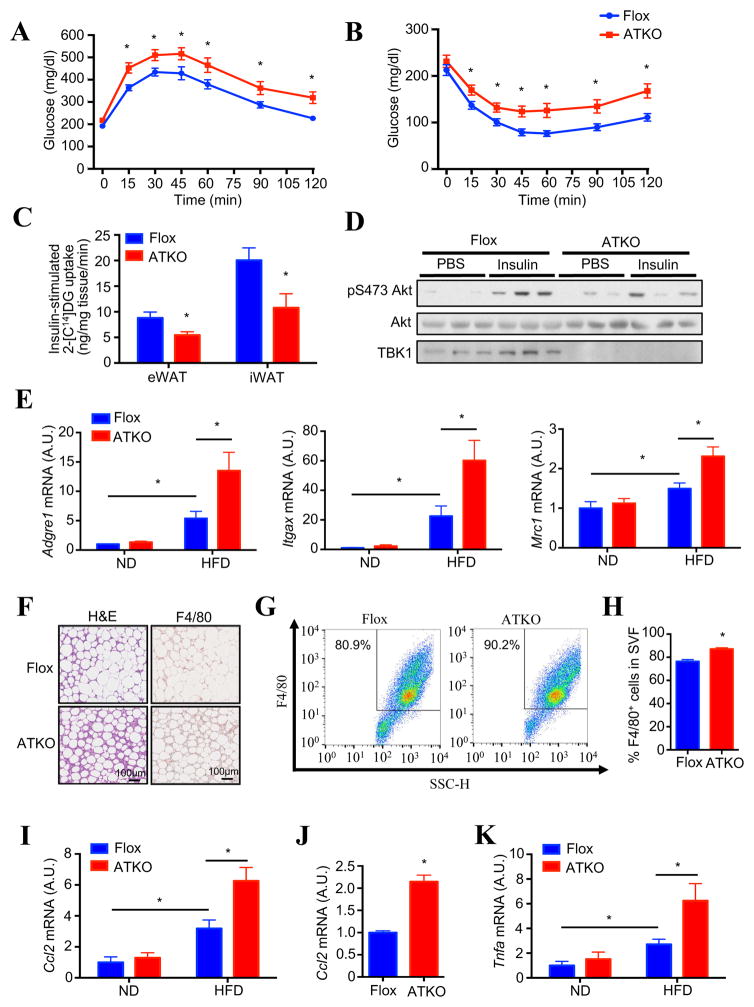
Figure 5. Adipocyte-specific TBK1 knockout mice have exaggerated HFD-induced glucose intolerance and insulin resistance, along with increased adipose inflammation.
(A) Glucose (1.2g/kg BW) tolerance test on 12 weeks HFD-fed Flox and ATKO mice. N=10–12. (B) Insulin (1.2U/kg BW) tolerance test on 12 weeks HFD-fed Flox and ATKO mice. N=10–12. (C) In vivo glucose uptake in eWAT and iWAT of 14 weeks HFD-fed Flox and ATKO mice. Each mouse was injected with 1.2g/kg glucose, 1U/kg insulin and 180uCi/kg 2-[C14]-deoxyglucose for 1hr. N=4–5. (D) IB analysis of eWAT in HFD-fed Flox and ATKO mice injected with PBS or 1.2 U/kg insulin. (E) Expression of macrophage marker genes in eWAT of 16 weeks ND or HFD-fed Flox and ATKO mice. N=6–8. (F) H&E (left) and F4/80 (right) staining of eWAT in HFD-fed Flox and ATKO mice. Scale bar, 100μm. (G, H) FACS analysis of F4/80+ cells in stromal vascular fraction (SVF) from eWAT of HFD-fed Flox and ATKO mice. N=4 from 10 mice. (H) is statistical analysis of (G). (I) Ccl2 (MCP1) expression in eWAT of 16 weeks HFD-fed Flox and ATKO mice. N=6–8. (J) Ccl2 expression in mature adipocyte fraction from eWAT of HFD-fed Flox and ATKO mice. N=6 from 12 mice. (K) Tnfa expression in eWAT of HFD-fed Flox and ATKO mice. N=6–8. Data are represented as mean±s.e.m. *, p<0.05. See also Figure S5.

