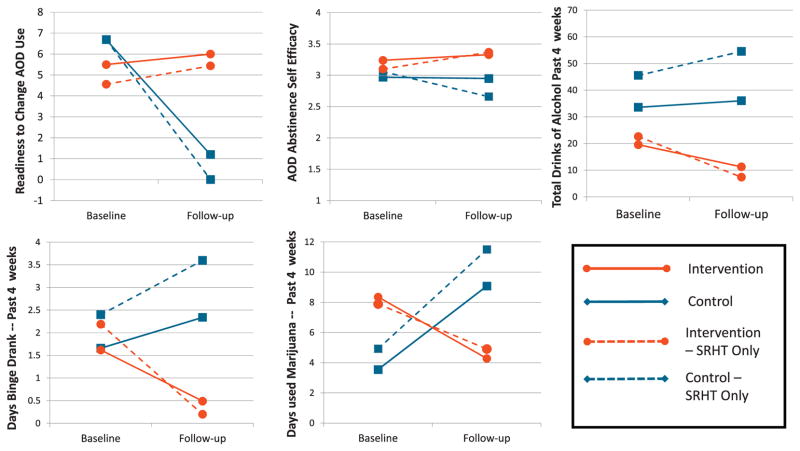
Fig. 3.
Baseline and Follow-up weighted mean estimates for the intervention and control groups. Line graphs show change between baseline and follow-up on model estimated means for intervention (red with circle end-points) and control groups (blue with square end points) on five key outcomes: readiness to change AOD use, AOD abstinence self-efficacy, alcohol drinking, and marijuana use. Each figure depicts measures for both the overall sample (solid lines) and the sample restricted to SRHT residents only (dashed lines).

