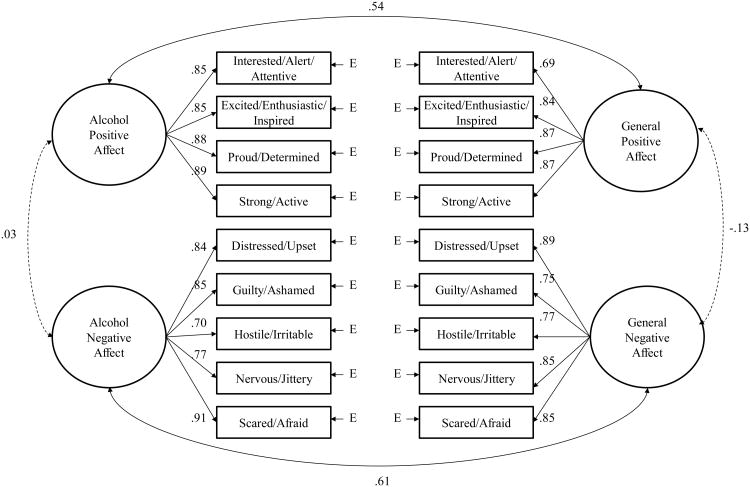
Figure 2.
Confirmatory factor analysis of alcohol and general positive and negative affect (parcels). Standardized coefficients next to bold paths are significant, p < .01. Correlations involving alcohol positive affect and general negative affect (r = .06, ns) and alcohol negative affect and general positive affect (r = .06, ns) are not displayed for diagrammatic clarity. E = measurement error.

