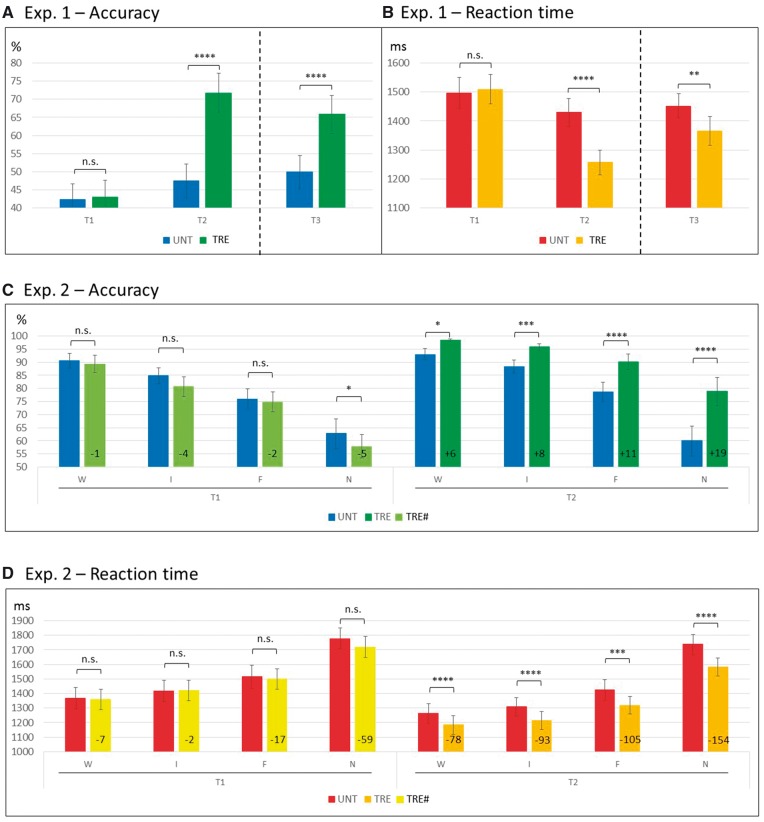
Figure 3.
Behavioural results of Experiment 1 (A–B) and Experiment 2 (C–D). Dispersions represent standard errors of the mean (SEM). Significance of post hoc comparisons: *P ≤ 0.05; **P ≤ 0.01; ***P ≤ 0.005; ****P ≤ 0.001; n.s. = non-significant. For Experiment 1, ANOVAs reported are run across T1 and T2 only, for consistency with all other analyses (results at T3 are reported to show performance at follow-up). Note that (C) illustrates that the differences between untreated and ‘to-be-treated’ items at T1 were either non-significant or counter the predicted direction (i.e. UNT > TRE#), whereas at T2 all differences were significant and in line with the predicted direction (TRE > UNT). % = percentage of correct responses; F = final; I = initial; N = noise; TRE = treated items (at T1, TRE# = ‘to-be-treated' items); UNT = untreated items; W = word.

