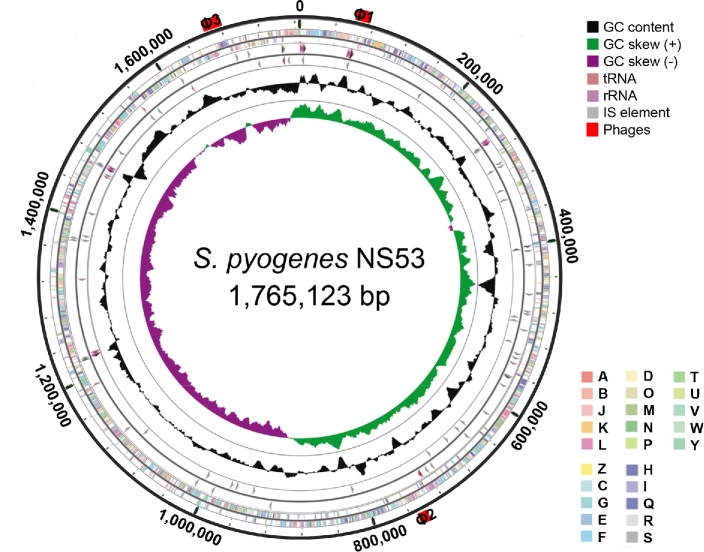
Figure 1.
Circular representation of the genome of GAS strain NS53. Data are shown from the outermost to innermost circles. Circle 1 indicates the genome scale in nucleotides. Circles 2 and 3 display the ORFs encoding in the forward and reverse strand, respectively. The colors of the ORFs indicate the COG functional categories. Circles 4 and 5 represent the RNA genes and short mobile elements (IS) in the forward and reverse strand, respectively. Circles 6 and 7 show the GC content and GC skew (G-C)/(G+C), respectively. The red bars outside the circle represent the locations and lengths of phage remnants. The COG categories are as follows: (A) RNA processing and modification; (B) chromatin structure and dynamics; (C) energy production and conversion; (D) cell cycle control and mitosis; (E) amino acid metabolism and transport; (F) nucleotide metabolism and transport; (G) carbohydrate metabolism and transport; (H) coenzyme metabolism; (I) lipid metabolism; (J) translation; (K) transcription; (L) replication and repair; (M) cell wall/membrane/envelop biogenesis; (N) cell motility; (O) post-translational modifications, protein turnover and chaperone; (P) inorganic ion transport and metabolism; (Q) secondary structure; (T) signal transduction; (U) intracellular trafficking, secretion and vesicular transport; (V) defense mechanisms; (W) extracellular structure; (Y) nuclear structure; (Z) cytoskeleton; (R) General function prediction only; (S) function unknown.

