Figure 1.
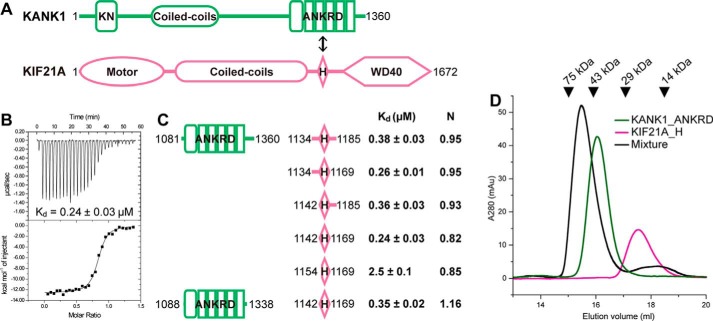
Biochemical characterization of the KANK1-KIF21A interaction. A, schematic diagrams of domain organizations for KANK1 and KIF21A. The interaction between the ANKRD and the short helical region in KIF21A is indicated by a double-headed arrow. KN, N-terminal 30-residue motif. B, the representative ITC curve showing the strong binding of KANK1_ANKRD to KIF21A_H. C, mapping of the minimal yet sufficient interacting boundaries for both KANK1_ANKRD and KIF21A_H based on ITC analysis shown in Fig. S1. Fitted binding ratios (N) are also indicated. D, gel filtration analysis of the complex formation using 60 μm Trx-KANK1_ANKRD (theoretical molecular mass of 44 kDa), 60 μm Trx-KIF21A_H (18 kDa), and their mixture. Elution volumes of standard size markers are indicated by arrowheads.

