Figure 1.
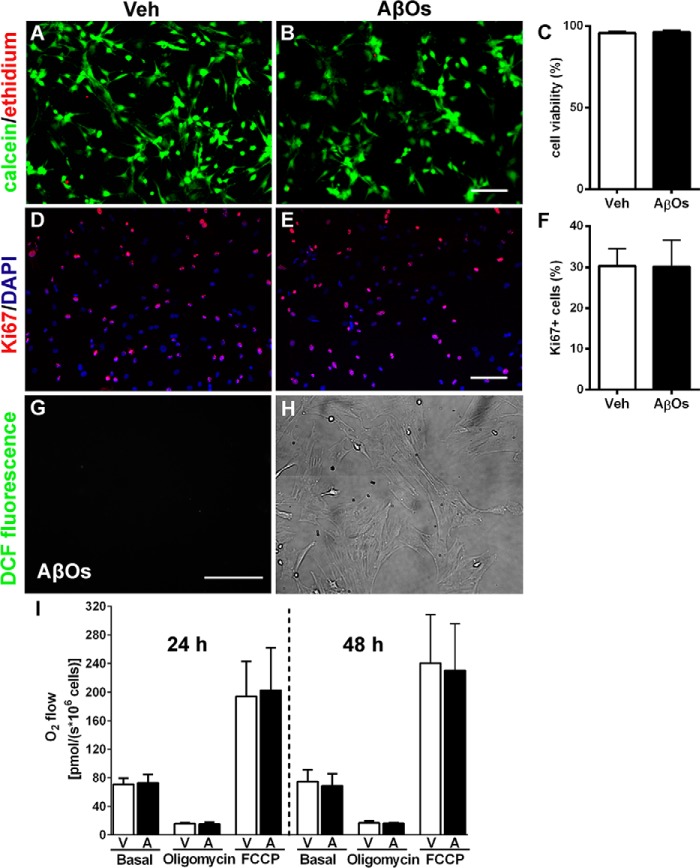
AβOs do not affect viability, proliferation, respiration, or resistance to oxidative stress of MSCs. Representative photomicrographs show viable (green) or dead (red) MSCs exposed for 72 h to vehicle (Veh) (A) or AβOs (500 nm) (B). Scale bar, 50 μm. Images were acquired on a Zeiss Axiovert 200M microscope with a 10× objective. Cell viabilities are shown in C (n = 3 independent cultures, with triplicate wells in each experimental condition). D and E, Ki67 immunofluorescence (red) and nuclei (DAPI) (blue) in MSCs exposed for 24 h to vehicle (D) or AβOs (500 nm) (E). Scale bar, 50 μm. Images were acquired as described above. F, percentage of proliferative cells, expressed as Ki67-positive cells (n = 3 independent cultures, with triplicate coverslips in each experimental condition). G, representative photomicrograph showing lack of DCF fluorescence in MSCs exposed to AβOs (500 nm) for 24 h; the corresponding bright field image is shown in H (n = 6 independent cultures, with triplicate coverslips in each experimental condition). Scale bar, 100 μm. Images were acquired on a Nikon Eclipse TE300 epifluorescence microscope with a ×20 objective. I, quantification of O2 flow (measured by high-resolution respirometry) under basal culture conditions or after the addition of oligomycin or carbonyl cyanide 4-(trifluoromethoxy)phenylhydrazone (FCCP) in MSCs exposed to vehicle (V) or AβOs (500 nm) (A) for 24 or 48 h (n = 3 independent cultures). In all graphs, data are represented as means ± S.E. (error bars).

