Figure 2.
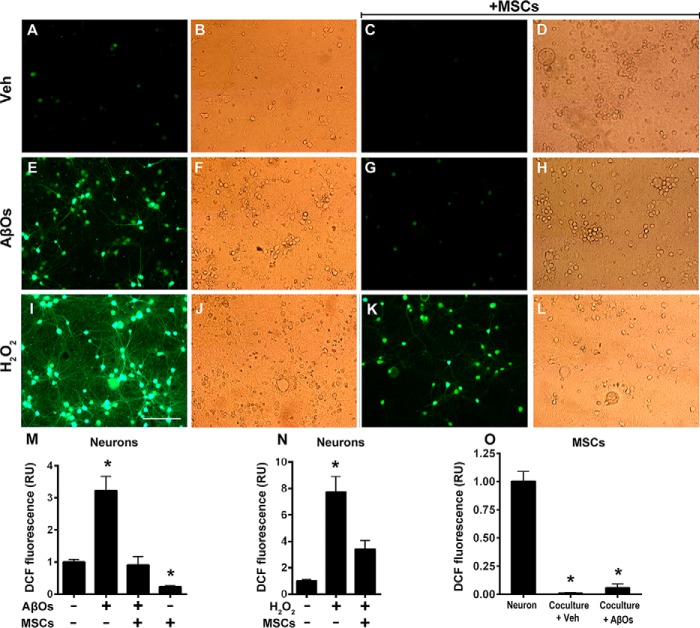
Oxidative stress in hippocampal neurons exposed to AβOs in the absence or presence of MSCs. Photomicrographs showing DCF fluorescence (green) in hippocampal neurons exposed to vehicle (A–D), AβOs (500 nm) for 6 h (E–H), or H2O2 (100 μm) for 10 min (I–L) in the absence or presence of MSCs, as indicated. Scale bar, 100 μm. Images were acquired on a Nikon Eclipse TE300 epifluorescence microscope with a ×20 objective. Corresponding bright field images are shown beside each fluorescence image. M–O, quantification of integrated DCF fluorescence intensity normalized by the total number of cells. Panels show integrated fluorescence for AβO-exposed neurons (M), H2O2-exposed neurons (N), or MSCs cocultured with hippocampal neurons and exposed to vehicle or AβOs, compared with hippocampal neurons alone (O). Data are represented as means ± S.E. (error bars) (n = 6 independent cultures, with triplicate coverslips in each experimental condition); *, p < 0.05; two-way ANOVA followed by Tukey's post hoc test; RU, relative units.

