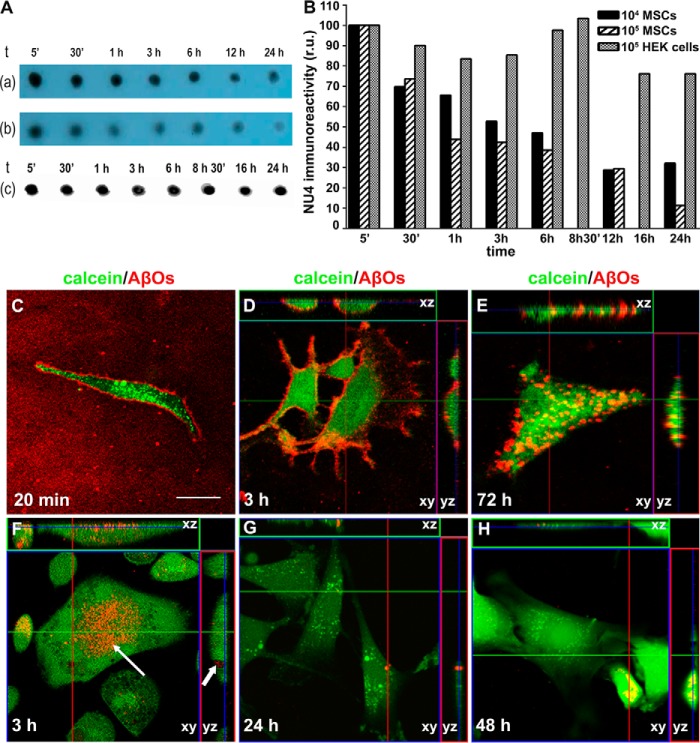
Figure 4.
MSCs internalize Aβ oligomers. A, dot-blotting analysis (using NU4 oligomer-sensitive antibody) (86) shows a time-dependent reduction in AβO immunoreactivity in the culture medium (top and middle lanes, corresponding to 104 or 105 MSCs/well (lane a or b, respectively). No decrease in AβO immunoreactivity was detected in the presence of 105 HEK293 cells/well instead of MSCs (lane c). B, the bar graph shows quantification by densitometry (using ImageJ version 1.38 software); r.u., relative units. C–H, representative images of AβO labeling (AβOs prepared using Hylite Aβ, as described under “Experimental procedures”; red) in MSCs (labeled with calcein; green) exposed to AβOs. C, MSCs exposed to AβOs for 20 min and imaging carried out in AβO-containing medium; D and E, MSCs were exposed to AβOs for 20 min, followed by exchange of AβO-containing medium by fresh medium and imaging after 3 h (D) or 72 h (E). Internalization of AβOs is evidenced by orthogonal projection analysis of confocal images obtained after 72 h (E). F–H, MSCs were continuously exposed to 500 nm AβOs and imaged after 3 h (F), 24 h (G), or 48 h (H). The kinetics of AβO internalization is accelerated by continuous exposure to AβOs (compare D and F). Arrows in F indicate AβO-containing roughly globular cytoplasmic structures in MSCs, suggesting that AβOs are located within an intracellular compartment after 3 h of exposure (F). D–H, lines indicate orthogonal sections of confocal imaged cells. Scale bar, 50 μm. Images were acquired on a Zeiss LSM510 META confocal microscope using a Plan-Neofluar ×40/1.3 numerical aperture oil differential interference contrast objective.

