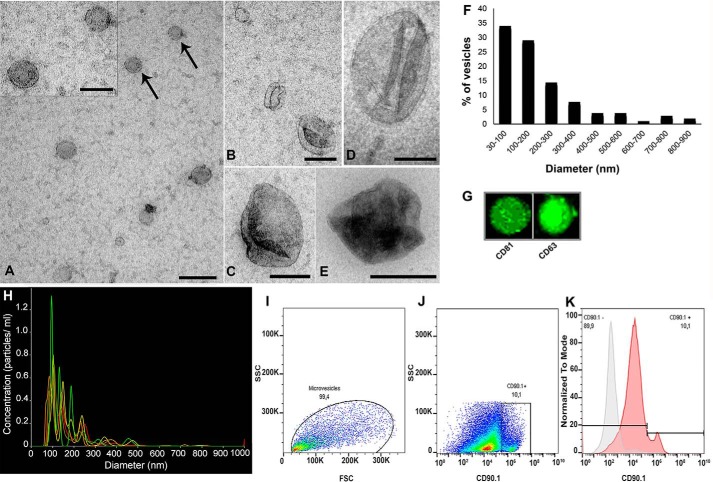
Figure 8.
Size distribution and immunological characterization of EVs released by MSCs. A–E, MSC-derived EVs were isolated (see “Experimental Procedures”) and mounted on grids for electron microscopy, negatively stained, and imaged by TEM. Smaller vesicles with diameters ranging between 30 and 200 nm (A–C) and larger vesicles with diameters ranging between 400 and 600 (D–E) nm could be visualized. Vesicles indicated by arrows in A are shown in higher magnification in the inset. F, frequency distribution of vesicle diameter derived from TEM analysis (n = 104 vesicles measured). Most (∼65%) of the vesicles ranged between 30 and 200 nm in diameter. G, dot blot analysis showing that EVs are immunoreactive for exosome-associated tetraspanins CD81 and CD63. H, NanoSight NTA. Size distribution of MSC-derived EVs showed predominance of particles with diameters ranging between 50 and 200 nm. Lines in different colors correspond to quintuplicate analyses from the same EV preparation. Scale bars, 200 nm (A, C, and D); 100 nm (A (inset) and B); and 500 nm (E). I, analysis of EV particle size distribution from forward scatter (FSC) and side scatter (SSC) by flow cytometry. J, microvesicles identified as CD90.1-positive particles. K, overlay of fluorescence histograms (normalized by the respective mode values) in a non-labeled sample (background control, gray curve) and a CD90.1-labeled sample (red curve), showing the presence of 10.1% CD90.1-positive microvesicles in the EV population.

