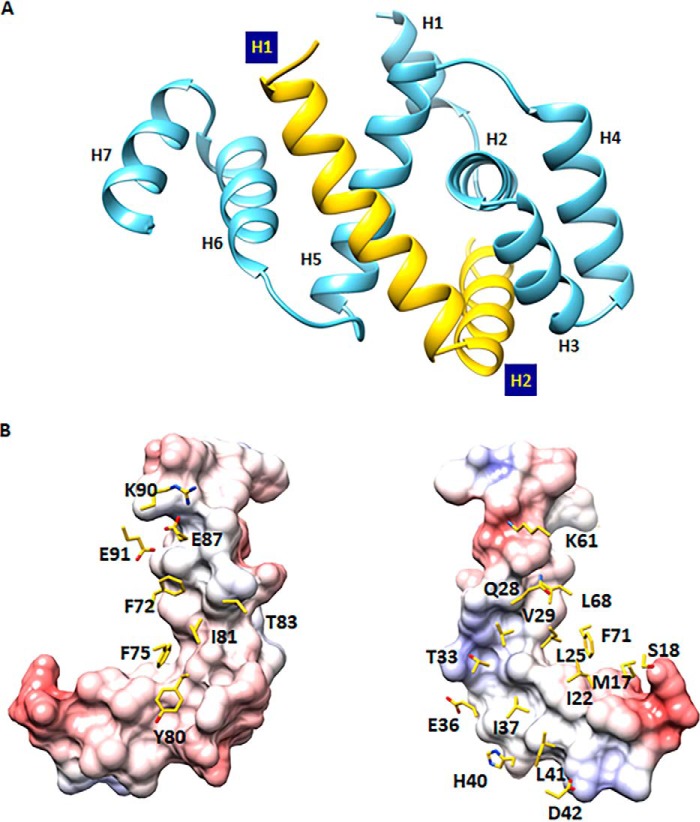
Figure 2.
Crystal structure of the FliFC–FliGN binary complex. A, graphic representation of the FliFC–FliGN complex with FliFC colored in yellow and FliGN colored in blue. B, the binding interface between FliFC and FliGN. FliFC is presented as a molecular surface colored by an electrostatic potential gradient, and residues of FliGN on the interface are presented as sticks.

